

![]()
Estimation of Different Biochemical Intensities in Drinking Water from Eastern Region of Lahore City
Muhammad Adnan Shana*, Fazeelat Tahirab, Muhammad Shafiquec, Manzoor Hussaina, Rukhsana Perveena, Muhammad Shahzada, Farhana Ehsana, Muhammad Saqib Shahzadd, Ziaur Rahmanc, Qurban Alic, Muhammad Iqbala
Adv. life sci., vol. 2, no. 3, pp. 131-134, May 2015
*Corresponding Author: Muhammad Adnan Shan (Email: adnanshan@camb.edu.pk)
Author Affiliations
b- Department of Chemistry, University of Engineering and Technology (UET), Lahore- Pakistan
c- National Centre of Excellence in Molecular Biology, University of the Punjab, Lahore- Pakistan
d- Department of Forensic Sciences, Institute of Molecular Biology and Biotechnology, The University of Lahore- Pakistan
Abstract![]()
Introduction
Methods
Results
Discussion
References
Supplementary Data
Abstract
Background: Lahore is city of over 8 million population with consumption of over 350 million gallons of fresh water per day. The present study was undertaken to determine the suitability of ground water from different areas of Mughalpura Lahore which is being used for drinking purposes.
Methods: The ionic concentration of TDS (total dissolved solids), TSS (total suspended solids), calcium, magnesium, sulphate, chloride, carbonate, bicarbonate and alkalinity in the collected water samples was determined. The concentration of heavy metals like Cu, Cr, Zn, Cd, As, Pb and Fe was estimated by applying American Society for Testing and Materials (ASTM) methods. The EC (electrical conductivity), pH, BOD (biological oxygen demand) and COD (chemical oxygen demand) values of the water were also measured. Data was statistically analyzed through analysis of variance technique.
Results: Increasing concentrations of heavy metals like Cu, Cr, Zn, Cd, As, Pb, Fe and TDS, TSS, calcium, magnesium, sulphate, chloride, carbonate, bicarbonate and alkalinity were obtained. The observed values of EC, BOD and COD were also high in range. Only the pH value obtained was in the range of WHO standards.
Conclusion: It was concluded from correlation among various chemical components in water like Ca+2, Mg+2, HCO3– and SO4-2 that this water is not safe for drinking according to WHO standards. The correlation among alkalinity, pH, Ca+2, Cl–, EC, HCO3–, SO4-2, TH and TSS further suggested that the samples with higher amount of these components must not be used for drinking purposes by animals and human.
Key words: Biochemical composition, drinking water, biological oxygen demand, chemical oxygen demand
Introduction
Fresh water immediately available for drinking and other purposes constitutes only 2.5% of the total water on earth [1]. Drinking water is neither always easily available and nor it is uniformly distributed over the earth. In many locations, the availability of good quality water is further reduced because of urban development, industrial growth and environmental pollution.
Drinking water contains very little amount of dissolved salts or minerals. Being the most common drinking fluid, water is also a potential source of transmitting diseases especially in developing countries. According to the WHO (World Health Organization) survey, 80% of all diseases in developing countries are water related [2]. Sewage is the major source of polluting drinking water, which enters the distribution system through leakage; causing serious diseases like cholera, typhoid, and GIT (gastro intestinal tract) upsets [3]. At least 2 to 5 million deaths are blamed on these water related diseases each year which include nearly two-third of the mortalities of children under five years old [4]. The contaminated water contains Al, Fe, Cu, Pb, Co, Cd, Br, As, At, Bs, Cs, Mn, Hg and Ag which can cause serious heart, liver, kidney and blood diseases. The heavy metals defuse in the animal body and become the part of their fats due to which harmful chemicals are produced causing the death of animals [5]. In order to use a healthy fluid for human consumption, water should be aesthetically acceptable, should be free from pathogenic organisms, carcinogenic metals, imbalance minerals, objectionable taste and microbial contaminants. Lahore is the most populated city of the Punjab province of Pakistan and demand for safe portable water in various areas is increasing day by day due to population explosion. At present, Lahore needs 350 million gallons of sweet water daily to cope with the demand of about 8 million people. Only six million gallons of this water can be met from the sub soil water by domestic pumps and tube wells [5]. The present study was undertaken to determine the suitability of ground water from different areas of Mughalpura Lahore which is being used for drinking purposes.
Methods
Drinking water samples were collected from twenty different areas of Mughalpura in sterilized plastic containers and stored at 4 °C. The selection of the samples was based on the health related problems in those areas due to contaminated water caused by factories and leather tanneries. The ionic concentration of total dissolved solids (TDS) [6], total suspended solids (TSS) [6], calcium, magnesium, sulphate [7], chloride, carbonate, bicarbonate, and alkalinity [8] were determined by volumetric methods. The Biological Oxygen demand (BOD) and Chemical Oxygen Demand (COD) values of the samples were determined by using ASTM standards for “water and environmental technology” published in the year 2002. Electrical Conductivity (EC) and pH values were determined by using pH meter and conductivity meter. Atomic Absorption Spectrophotometer (AAS) Varian-1275 was used to determine the concentration of Cu Cr, Zn, Cd, As, Pb and Fe [9,10]. The data was collected and analyzed by using analysis of variance technique [11].
Results
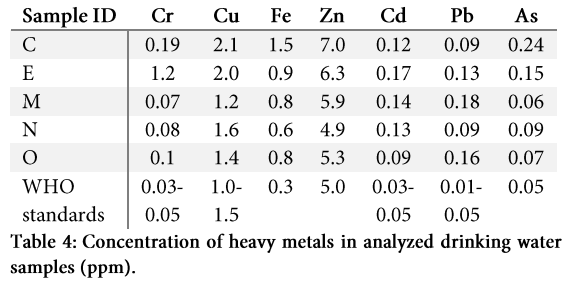
Observed values of TDS, TSS, calcium, magnesium, sulphate, chloride, carbonate, bicarbonate, alkalinity, EC, pH, DO, BOD, COD in the analyzed water samples are shown in table 1. The concentrations of Cu, Cr, Zn, Cd, As, Pb and Fe present in the analyzed water are shown in table 4.
Results of each parameter were compared with WHO recommended standard values as shown in table 1 and 2 in supplementary data [12]. It is evident from table 1 (supplementary data) that significant differences were found for all studied biochemical traits of water samples. The results from table 2 (supplementary data) clearly indicate that sample K is severely alkaline (1151.6 ppm) followed by L (1076.6 ppm) while low alkalinity (464.57 ppm) was observed for O followed by N (442.57 ppm). The average alkalinity observed for all samples was 749.23±4.7204 ppm. Higher values for alkalinity revealed that the water samples K and L are hazardous for health of dwelling organisms.
Sample D & E represent higher value for BOD (2.666 ppm) while sample K indicates lower (0.786 ppm) followed by J (0.666 ppm). The average BOD for all samples was 1.648±0.5004 ppm. High BOD values illustrate that there might be some pathogenic organisms present in the respective water samples.
High values of carbonate ions (CO3-2) were estimated for sample C (15.316 ppm) followed by sample B (18.316 ppm) while it was lowest for samples A, E, L, N and O (0.316 ppm). The average quantity of carbonate ions (CO3-2) present in all samples was 6.236±0.9525 ppm.
Highest COD was recorded for sample C (574.37 ppm) followed by sample D (562.07 ppm) while lowest value was recorded in Sample N (385.57 ppm) followed by Sample O (380.07 ppm). The average COD for all samples was 456.31±6.2276 ppm.
Dissolved oxygen (DO) was recorded in the range of 4.166-5.666 ppm. The average DO for all samples was 4.946±1.7061 ppm. EC was estimated in the range of 2.266–5.266 mS/cm. The average EC for all samples was 3.806±0.5004 mS/cm.
Values recorded for calcium ions (Ca+2) were in the range of 453.57-803.57 ppm. The average calcium ions (Ca+2) for all samples was 573.37±4.7204 ppm. Higher values of chloride ions (Cl–) were obtained for sample J (933.57 ppm) followed by sample L (915.57 ppm) while least for sample O (358.57 ppm) followed by sample C (331.57 ppm). The average chloride ions (Cl–) for all samples were 583.57±7.7348 ppm. Minimum value for bicarbonate ions (HCO3–) was estimated in sample H (563.07 ppm) while maximum for sample B (977.07 ppm). The average bicarbonate (HCO3–) ions for all samples was 775.93±3.2133 ppm. Higher values of magnesium ions (Mg+2) were recorded for sample B (1287.1 ppm) followed by sample A (1155.1 ppm) while lowest was in sample O (445.07 ppm). The average magnesium ions (Mg+2) for all samples was 767.13±6.2276 ppm. Sulphate ions (SO4-2) were recorded in range of 382.57-997.57 ppm. The average sulphate ions for all samples were 657.7±7.7348 ppm.
Higher value of TDS was resulted for sample I (3732.6 ppm) followed by sample K (3703.6 ppm) while lowest for sample M (2264.6 ppm) followed by sample A (2251.6 ppm). The average TDS for all samples was 2940.3±4.7204 ppm. Sample F (5853.1 ppm) represented the higher value of TH followed by sample F (5061.1 ppm) while sample M (2431.1 ppm) had lowest followed by sample N (2378.1 ppm). The average TH for all samples was 3681.2±9.2419 ppm. TSS was observed in the range of 2.466-7.666 ppm. The average TSS for all samples was 4.4927±1.4047 ppm.
High values of pH was shown in sample J (8.666) followed by E (8.466) and sample K (8.466) whereas lowest was for sample H (7.366) and sample N (7.366) followed by sample I (7.266). The average pH for all samples was 7.806±1.7061.
It can be inferred from the results (table 3) that significant correlation exists between alkalinity with COD, Cl–, EC, HCO3–, SO4-2, TDS and TH. Similarly, BOD is in significantly correlation with CO3-2, COD and HCO3– and SO4-2. The pH was significantly correlated with Ca+2, Cl–, DO, EC, HCO3–, SO4-2, TH and TSS. The interrelation of all studied traits indicated the amount of any one of the component may cause an increase in the relative amount of the other component in drinking water. The correlation between Ca+2, Mg+2, HCO3– and SO4-2 suggested that the water samples with optimum amount of these chemical components is fit for irrigation purposes and it is not safe for drinking. The correlation among alkalinity, pH, Ca+2, Cl–, DO, EC, HCO3–, SO4–2, TH and TSS also suggested that such type of water is not safe for drinking purposes by animals and human.
Discussion
High TDS levels may cause excessive scaling in water pipes, water heater, boiler and household appliances such as kettle and steam iron. High levels of salts cause hardness which has a close relationship with cardiovascular diseases [13]. It also increases the soap consumption and produces soap curd, which can cause irritation on skin. Sulphate is one of the least toxic anions. However, high concentrations of sulphate in water can cause catharsis, dehydration and gastrointestinal irritation [14]. High chloride level causes human illness and also affects plant growth [15]. Irritation in eyes and other skin disorders are associated with higher value of pH (8-11) [16]. It also indicates the presence of toxic elements in water. Similarly, deficiency of copper causes anaemia, loss of hair pigment, growth inhibition and loss of arterial elasticity [17]. The depletion of dissolve oxygen in water can encourage the reduction of nitrates to nitrides and sulphates to sulphides giving rise to odor problems [18]. High values of COD represent the presence of organic contamination in water that is harmful for the human consumption. The major disadvantage of presence of iron in water is that it increases the hazard of pathogenic organism as most of them need iron to grow. The water management authority in the studied areas is mainly responsible for inferior quality of water. The older corroded underground supply water distribution system is the main source of contamination. Mixing of wastewater into the water distribution system through leakage is more common in old fabricated and congested locations where the supply and sewerage lines are running side by side. The resident of these areas are usually exposed to health problems due to inferior water quality.
According to WHO standards, the examined water quality is lacking the valuable recommendations criteria and showing the inaptness for the drinking purpose. Therefore necessary measures should be taken to avoid the mixing of waste water with the drinking water and to improve the quality of drinking water.
References
- Oki T, Kanae S. Global hydrological cycles and world water resources. Science, (2006); 313(5790): 1068-1072.
- Ashbolt NJ. Microbial contamination of drinking water and disease outcomes in developing regions. Toxicology, (2004); 198(1): 229-238.
- Khan SU, Bangash fK. Drinking water quality forecast of Peshawar valley on the basis of sample data. Journal of Chemical Society of Pakistan, (2001); 23(4): 243-251.
- Gleick PH. Global freshwater resources: soft-path solutions for the 21st century. Science, (2003); 302(5650): 1524-1528.
- Naees M, Ali Q, Shahbaz M, Ali F. Role of rhizobacteria in phytoremediation of heavy metals: an overview. International Research Journal of Plant Sciences, (2011); 2220-232.
- Bashir R, Nawaz H, Khurshid M. Chemical analysis of underground water of Faisalabad city sector-II (areas along Narwala and Sargodha road). Pakistan Journal of Biological Sciences, (1999); 2715-719.
- Chapman PM, Paine MD, Arthur AD, Taylor LA. A triad study of sediment quality associated with a major, relatively untreated marine sewage discharge. Marine Pollution Bulletin, (1996); 32(1): 47-64.
- Miles D, Espejo C. Comparison between an ultraviolet spectrophotometric procedure and the 2, 4-xylenol method for the determination of nitrate in groundwaters of low salinity. Analyst, (1977); 102(1211): 104-109.
- Boyle EA, Edmond JM. Determination of copper, nickel, and cadmium in sea water by APDC chelate coprecipitation and flameless atomic absorption spectrometry. Analytica Chimica Acta, (1977); 91(2): 189-197.
- Bach H, Tarre S, Green M. Post treatment of groundwater denitrification fluidized bed reactor effluents to achieve drinking water quality. Journal of Industrial Microbiology and Biotechnology, (1998); 20(6): 354-359.
- Larson MG. Analysis of variance. Circulation, (2008); 117(1): 115-121.
- Gorchev HG, Ozolins G. WHO guidelines for drinking-water quality. WHO chronicle, (1984).
- Smith W, Crombie I. Coronary heart disease and water hardness in Scotland–is there a relationship? Journal of epidemiology and community health, (1987); 41(3): 227-228.
- MacKinnon A, Taylor S. Relationship between ‘sudden’coronary deaths and drinking water hardness in five Yorkshire cities and towns. International Journal of Epidemiology, (1980); 9(3): 247-250.
- Ellenhorn MJ, Barceloux DG. Diagnosis and treatment of human poisoning. Medical Toxicology, (1997); 609-610.
- Srividya B, Cardoza RM, Amin P. Sustained ophthalmic delivery of ofloxacin from a pH triggered in situ gelling system. Journal of Controlled Release, (2001); 73(2): 205-211.
- Kumar N, Low PA. Myeloneuropathy and anemia due to copper malabsorption. Journal of Neurology, (2004); 251(6): 747-749.
- Scaglia B, Orzi V, Artola A, Font X, Davoli E, et al. Odours and volatile organic compounds emitted from municipal solid waste at different stage of decomposition and relationship with biological stability. Bioresource Technology, (2011); 102(7): 4638-4645.