
Review Article
An Overview of Genome-Wide Association Study for Genetics Novices: A Review
Hafsa Tahira, Aniqa Ejazb, Tania Mahmoodb, Sidra Riazc, Rashid Saif b, d, e*
Adv. life sci., vol. 6, no. 3, pp. 88-96, May 2019
*- Corresponding Author: Rashid Saif (Email: rashid.saif37@gmail.com)
Authors' Affiliations
b- Institute of Biotechnology, Gulab Devi Educational Complex, Lahore, Pakistan
c- Department of Gynaecology and Obstetrics, Government Hospital Samanabad, Lahore, Pakistan
d- Decode Genomics, 264-Q, Johar Town, Lahore, Pakistan
e- Institute of Genetics, University of Bern, Switzerland
Abstract![]()
Introduction
Methods
Discussion
Conclusion
References
Abstract
SNP chip-based genome-wide association studies (GWAS) is an inspiring and fast scanning method for mapping variations within the genome and associating them with specific diseases/trait. This association information has enhanced the chances of improvement in disease diagnosis, understanding the causative variants locations and associated gene hunting strategies. GWAS have laid foundation of an era in which both personalized medicine and pharmacogenomics would be reinforced along with better understanding of functional genomics aspects of modern molecular genetics. Since the advent of first GWAS in 2002, thousands of genome wide association studies have been published which have proven GWAS a successful methodology in identifying significant variants in disease/trait association but application of GWAS outcomes to clinical settings demands more evaluation for validity. Here, we have divided the GWAS approach into various aspects including history, development, analysis strategies, approaches, current scenario and different applications with brief description of major methodologies being used in scientific community to get associated SNP hits and narrowing down the search by functional variant filtration involved in subject disease, traits or physiological condition.
Keywords: GWAS, Genetic Association, Linkage Disequilibrium, HapMap, PLINK
Introduction![]()
The curiosity to find out the potential characteristics of an individual person has developed state of the art technologies for having insight of different diseases during the last few decades. Human genetics is therefore intended to find the genetic risk factors for such diseases. Earlier genetic association studies were based upon candidate gene approach; selecting a genetic variant on the basis of known etiology of a disease and genotyping either one or few known variants by PCR. Later on, this approach was superseded by genome-wide approach, in 2002 when first successful GWA study about ‘’myocardial infarction’’ was published followed by the publication of GWAS on “molecular degeneration associated with age’’ in 2005[1]. Genome wide association study comes under the umbrella of all those tools and technologies which help in identifying the genetic risk factors. GWAS finds the variations in DNA sequences and evaluates, if they cause the risk for developing any disease or disorder. Considering humans, GWAS does this search across the whole human genome thus, called “genome wide” association study. On the basis of this search, GWAS then assists in development of novel prevention and treatment plans, by revealing the biological roots of disease predisposition. By looking at the genomes, it becomes clear that, 99.9% of the genome is same in every human being or in other words humans are 0.1% genetically different. So, it is this 0.1% of human genome which serves as homeland for different types of variations [2]. Among these genomic variations, the one which is most abundant almost accounting for 90% all sequence variations, an estimate made in 1998, is SNP or single nucleotide polymorphism. SNP is now considered as modern unit of genetic variation; most of SNPs are those which are common in human populations [3]. SNPs are single base pair changes in DNA sequence which have huge impact on human health. SNPs are classified into two types: functional/ non-synonymous and neutral/synonymous. In GWASs, we are chiefly concerned with neutral or synonymous SNPs and, we use them as genetic markers because of their good number and generation by generation stable inheritance [4]. Functional SNPs which constitute 3 to 5 % of human SNPs give rise to phenotypic variations by altering the mRNA transcript stability or transcription factor binding capability [5]. It is quite tough to find affiliation of SNPs with complex or common diseases. But there is one hypothesis which targets to simplify these affiliation intricacies is “Common Disease/Common Variant Hypothesis’’ [6]. This hypothesis suggests that, the genetic underpinnings of common diseases are different from those of rare disorders. It also states that, common genetic variations are more probable to influence common diseases than, rare disorders; common genetic variations cause common diseases while, genetic variations with low frequency of occurrence or rare variations cause rare disorders. Low frequency variants are often regarded as ‘mutations’. Over the last few years, this hypothesis has been tested for several common diseases and the results are suggestive of the fact that Common Disease/Common Variant Hypothesis is true. Over 3,600 SNPs associated with common traits or diseases have been identified and, are listed in The National Human Genome Institute GWAS catalogue [7].
Methods![]()
Literature survey and selection criteria
Google Web, Google scholar, NCBI Databases and OMIC Tools were used to obtain data for this review paper. Different key words and MeSH terms were used to retrieve the required research articles and bioinformatics-based information; such as “GWAS Tools’’ and “GWAS analysis procedure’’. Research papers consulted for this review were those published over last 10 to 15 years and information regarding GWAS analysis was considered for current review.
Discussion![]()
The GWAS catalogue
The GWAS Catalogue is an organized, publicly available resource, which provides good knowledge about associations between SNPs and phenotypic traits. It was originally created in 2008, by National Human Genome Research Institute (NHGRI). But from 2010, its delivery, quality control and, manual curation has become a collaborative act of NHGRI and European Bioinformatics Institute (EMBL-EBI). It provides a collection of 1751 selected, published genome wide association studies. These publications assay approximately 11912 SNPs[8], and their number increased largely every year; leading to the need of automated curation, which was achieved in 2013, with the deployment of an infrastructure having an automated capability of performing PubMed searches. In addition to this, the Catalogue also provides an iconic diagram of SNP-trait associations with p values ≤ 5×10⁻⁸, mapped onto human karyotype. The latest version of this diagram is available in SVG format at EMBL-EBI website [9]. Various Human diseases are categorized into 17 main groups, each possessing different dot colour. There are three different ways in which GWAS Catalogue can be accessed;
- via tabular web-interface
- via a dynamic query interface
- As an OWL knowledge-base
Missing heritability and CNVs
Despite the fact that GWAS has been successful in explaining the variance in complex diseases/traits, but identifying only SNPs has resulted in a portion of variance which is still un-explained. This missing variance portion is referred to as missing heritability. Some of this missing information can be clarified by copy number variants or CNVs; deletions/duplications constituting whole DNA segments of minimum size 1000 base pairs [10]. We can say that, in the case where SNPs could not show association for diseases, CNVs might yield some signal. A good example for proving this statement is the case of autism [11]. CNVs can account for a part of missing heritability.
The international HapMap project
Several efforts were made to identify the common genetic variants and find their association with common diseases. One most successful effort in this regard is “The International HapMap Project’’ launched by The International HapMap Consortium to develop a haplotype map. The HapMap is a short form of Haplotype Map; haplotype is a set of SNPs that are located on a same chromosome. HapMap thus allows the researchers to sample a bunch of selected SNPs rather than working on a single SNP at one time. Each haplotype block is represented by specific SNP known as tag SNP and there 500,000 tag SNPs. This has reduced the number of SNPs needed to examine whole human genome from 10 million SNPs to 500,000tag SNPs. During phase I of International HapMap Project over a million SNPs [12] were added to the map and over 2.1 million during phase II [13]. HapMap III provided 1.6 million more SNPs [14]. The genotype data obtained from HapMap is then examined for linkage disequilibrium.
Linkage disequilibrium
Each SNP typically constitutes two alleles; minor allele (occurring less frequently) and the major allele (occurring more frequently), which are the two possible base pair locations for the occurrence of that SNP with in the population. Linkage disequilibrium is the property of SNPs which allows the determination of correlation between the two alleles, or their pattern of inheritance. In population genetics, the term linkage disequilibrium is used to mathematically describe the changes which occur in genetic variants over the number of generations [15]. Linkage disequilibrium, highlights the physical relationship between two SNPs or markers lying on a same chromosome, in other words it states that the two SNPs remain physically connected to each other on a chromosome, unless separated apart by recombination. Thus, linkage disequilibrium can be referred to as linkage between SNPs occurring on a population scale.
If linkage disequilibrium exists, it leads to two possible outcomes: direction association and, in direct association. GWAS involves both direct and indirect genotyping techniques required for these two association possibilities, but additional measures are still needed for mapping the exact location of influential SNP. Mapping, over 1 million human SNPs and testing Common Disease/Common Variant Hypothesis was quite a big deal and it became possible with such genotyping technologies that allowed for accurate capture of 1 million SNPs for every single study subject in a cost and time effective manner [16].
Conducting a Genome Wide Association study
In order to conduct a genome-wide association study, the requirement is to keep in mind the assumed genetic model of the trait and select the technology for assessing the genetic variation. It is necessary to characterize the phenotype of interest first. Once this is done the next step is the choice of study design.
- Study design
There are two types of phenotypes namely, categorical and quantitative. On this basis of these phenotype categories study designs have been classified into binary or case/control and quantitative types. Case/control study is possible with categorical phenotype/trait and quantitative study involves the quantitative phenotype. Although, the results of a quantitative study are preferred, they do not promise for success in every study [17, 18].
Case-control study
When we selects a trait/disease with less established quantitative measures then, preferred study design would be case/control study design. Selection of the case/control study design requires an important consideration, which is to make sure that the cases and the controls possess same ancestry.
- Genotyping
Once the selection has been performed, the next thing to focus is the genome wide SNP genotyping. Genome wide SNP genotyping involves assessment of million SNPs, for each of our case and control subject.
Genotyping technologies
Genotyping can be done in multiple ways, depending upon the technologies being used. Genotyping a huge number of SNPs became possible because of the chip-based microarray technology [19]. Microarray technology allows relatively better assaying of SNPs than other technologies, such as those based on enzyme, hybridization and, sequencing, etc. There are two main platforms that provide chip based microarrays for GWASs; Affymetrix (Santa Clara, CA) and Illumina (San Diego, CA). Recently, a review of these two technologies has been done [20], which provides various approaches to detect and map SNP variations.
Microarray chips
Products of Affymetrix platform depict DNA sequences of short length in the form of spots on the chip, corresponding to SNP alleles. Whereas, as products of Illumina are constructed on the basis of bead-based technology. Bead based technology uses DNA sequences with a slightly longer length than used by Affymetrix microarrays [21]. So, the working principle is also different for these two types of chips.
Designing a microarray chip
Design a microarray chip, requires the idea of the SNPs associated with the disease, which comes from the available SNP Databases, Hap Map and, other such resources. To find out the DNA sequence around our required SNP we can get help from the sequencing data provided by Hunan Genome Project. Microarray chip uses this information to determine SNP genotype. Let’s consider using an Affymetrix chip; capable of assaying over 100,000 SNPs simultaneously. Each Affymetrix microarray is like a checkerboard, constituting 400,000 squares known as features [22]. Each feature contains millions of identical copies of a specific DNA sequence or probe (usually 25 bp long), representing specific SNP genotype. Within a chip these probes are stacked upon each other in a parallel fashion, or there are multiples layers in a chip.
Preparing DNA for genotyping
After designing the probes to genotype SNPs, we need to obtain blood or saliva sample of each subject for DNA extraction. Required regions of extracted DNA are amplified using PCR. The amplicons are then denatured and labelled with a chemical known as biotin, which serves as a glue for the fluorescent material to be washed over the array in later steps.
Chip functioning and output
DNA samples are loaded on the chips and are allowed to undergo hybridization; the basic underlying principle of microarray chips. Hybridization occurs between the two types of DNA strands, single stranded sample DNA and microarray probe, only where there is a complementarity between them. Thus, probes detecting required SNPs will hybridize with the fragments containing those SNPs and rest of the fragments will be washed. Washing the array with fluorescent dye, will lead to the clear identification of matches between two DNAs, as biotin bound to only hybridized DNA fragment will be available for sticking with the fluorescent material and rest of it will be lost along with unhybridized DNA. The microarray is then scanned with the help of a specific scanner which excites the fluorescent dye with laser and its built-in detector measures the fluorescence emission levels. The resultant output is in the form of image showing all the features having different intensities [23]. Intensity of fluorescent signal depends upon the number of DNA fragments hybridizing. Output is stored in .CEL file format, containing intensity calculation results and previous data about each feature on the microarray.
- Data pre-processing
Pre-processing commences with identification of the data type/format which needs be processed, and this depends upon the method being adopted for the SNP genotyping. We are considering here the example of Affymetrix platform, Affymetrix 6.0 gene chip provides output in .CEL format. Based on chip design and other related factors there are various algorithms for genotyping SNPs on Affymetrix arrays, i.e., BRLMM, DM and, Birdseed. Out of these, the tool most appropriate for Affymetrix 6.0 gene chip is Birdseed calling algorithm. Birdseed produces genotypes and confidence scores for every sample at every SNP by using a special Expectation Maximization algorithm. In order to be read by R, the output obtained requires to be converted into .ped and .map files (Figure 1). This is done by using PERL scripts. Both .ped and .map file formats can be easily read by R, but better choice is to convert these two files into .bed, .bim and .fam files. PLINK toolset is used for this file format conversion.
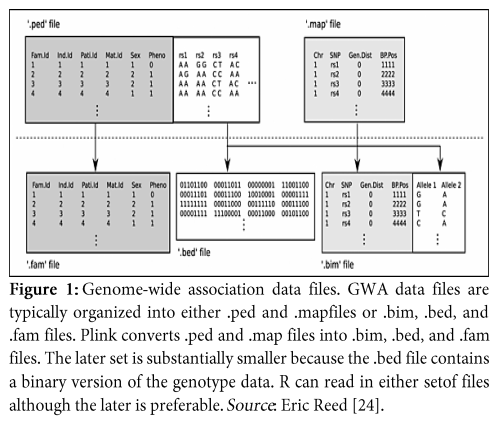
.ped and .map files
Dot ped files constitute complete information about every single study subject, such as his ID, age, gender, phenotype etc. Whereas, .map files constitutes rows of SNPs with their rs-numbers along with chromosome number and coordinate information.
.bim, .bed and .fam files
Dot (.) bim files contain a combination of information stored in both .ped and .map files while, .bed files constitute genotype data in binary form. .fam files contain information required for the identification of each study subject.
PLINK
It is a C/C++ whole Genome Association Toolset (WGAS) [25], having capability of performing association analysis for both quantitative and case/control studies. It was designed by Shaun Purcell. It is freely available and very commonly used to perform a wide variety of genetic analyzations. Some of its important functions are in the domains of data management, basic/summary statistics, linkage disequilibrium estimation and calculation, population stratification, Identity by descent and identity by state estimation etc.
- Installing Software packages and specifying the parameters
Bioconductor is free available software repository, which contains a good range of bioinformatics softwares. Some of the software which are required for performing different data related manoeuvres during GWAS are namely: SNPStats, SNPRelate, Rtracklayer, LD heatmap, ggplot2, postgwas, plyr Package and doParallel.
- Generating R objects
Reading and formatting data in R
Once we have installed all the required software packages then comes the reading of .bim, .fam and, .bed file in R, Read PLINK function from SNPStatsis used for reading. The output which we get from this step is snpMatrix; a matrix of genotype data consisting of rows (study subjects) and columns (SNPs).
SNP level filtering
Once reading in clinical and genotype data is done, we must proceed to SNP level filtering. In this step, we remove those SNPs which do not fall into the criteria of required MAF (Minor Allele Frequency) and call rate (the percentage of study subjects for which the related SNP information is available).
Sample level filtering
Next step is performing filtering at basic sample level. Here we need to remove those study subjects for whom there is some same data missing or sample contamination or ambiguities about gender/race occur. Such filtering is done on the basis of following factors:
- Call rate: missingness across the typed SNPs.
- Heterozygosity: occurrence of the two alleles at a given SNP within the individual.
- Cryptic relatedness: selected samples are of close relatives.
- Offspring-parent gender incompatibilities
SNP level filtering (B)
In this step, we specifically remove those SNPs which deviate from Hardy Weinberg Equilibrium (HWE). While performing SNP level filtering, we eliminate those SNPs for which p-value is < 1×10⁻⁶ [26].
- Generation of new data
After performing complete quality control analysis and filtering, we can use the output R SNP-Matrix object (subset) to generate two new forms of data, upon which statistical analysis can be made later on; Principal Components and genotypes of untyped SNPs.
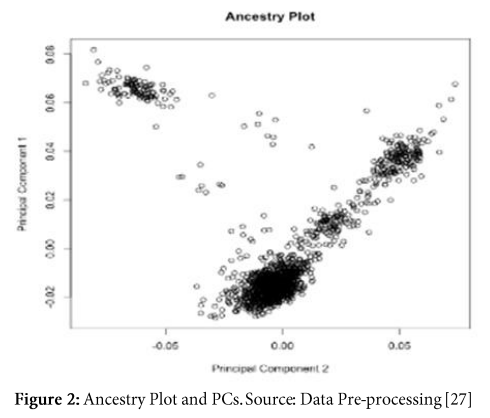
- Generating principal components
Generating two principal components of genotyped data helps us understanding the ancestry. Moreover, these principle components capture information about population substructure (genetic diversity due to migration, mutation or selection within population seeming homogeneous) (Figure 2).
- Imputation: creating genotypes for untyped SNPs
In this step, we generate genotypes for those SNPs which are not typed. We do this to have extra power to identify SNP-disease association. Genotypes created in this step are for those SNPs which seem to have significant relationship with the outcome. To perform genotype imputation, we need some sort of reference data, such as that from HapMap or 1000genomes. We define imputation rules first and then we remove those untyped SNPs which do not derive those rules. This process is complex and should be dealt with great care. Important algorithms which can perform this task include: IMPUTE, Beagle and MaCH etc.
Statistical analysis of data
- Association analysis of typed SNPs
In this step, we perform association analysis of typed SNPs, which is nothing else but, regression of every single typed SNP on a given phenotypic trait/disease with the adjustment made on levels: Subject-level (clinical), Demographic level and the Environmental level.
- Association analysis of imputed Data
Association analysis of imputed data can be performed with many software packages such as: ProbABEL, BIMBAM, SNPTEST, MACH2qtl/dat and BEAGLE
Post analytic visualization and genomic integration
- Data integration
In this step, we assign SNPs to chromosomal loci and provide chromosomal and base-pair locations; positions/coordinates. Syndication of typed SNP data results and Imputed un-typed SNP data results is also required here.
- Visualization of Results
Several Visualization approaches can be used for GWAS findings, which provide simultaneous quality control checks as well. Three main visualization tools are: Manhattan plot, Q-Q plot and Heat Map.
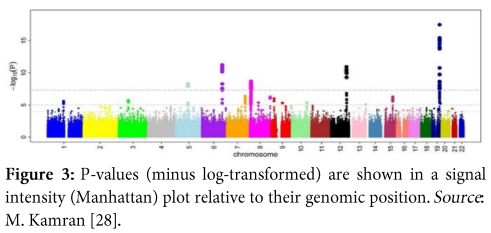
- Manhattan plot
It is a scatter plot, which provides the significance level of the study by displaying a huge number of data points; each point representing a single SNP. Here as in (Figure 3), we can easily visualize results of GWA analysis, the y-axis constitutes p values of SNPs which have been transformed into minus log form and the x-axis represents chromosomal numbers.
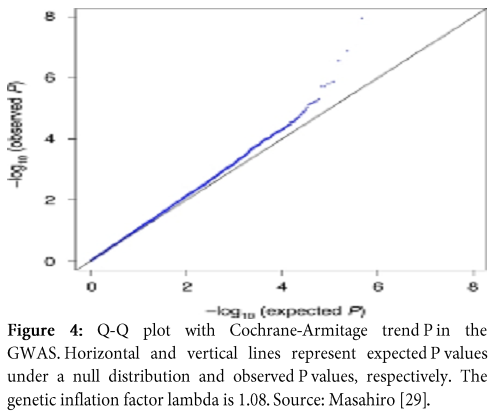
- Q-Q plot
Q-Q plot is an abbreviation of Quantile-Quantile plot, which is graphical representation of the crude relationship between two data sets; quantile of observed SNP-level test statistics (y-axis) and quantile of expected SNP-level test statistics (x-axis). Q-Q plot also enable us to visualize the status of population stratification (Figure 4).
- Heat Map
A heat map is a type of visualization tool which provides output in the form graphical representation where, each matrix value has its specific color. It actually enables us to visualize patterns of linkage disequilibrium between our observed SNPs and the expected SNPs.
Additional post-analytic interrogation
After GWA analysis has been made, there are still many options available for performing additional interrogation, such as: meta-analysis, replication analyses and many others.
- Meta-analysis
In meta-analysis, we combine the results of multiple GWA studies, by keeping in mind the basic principle of meta-analysis; all the studies selected for combined analysis must be have same underlying hypotheses. Thus, we can transform our study into a large magnitude study and observe the combined significance of multiple studies. It would not have been possible without meta-analysis technique. Meta-analysis of GWAS has played huge role in the discovery of a large number of the newly identified genetic risk factors associated with complex diseases [31]. There are many commercially available software packages which can be used for meta-analysis. Commonly used tools are those, provided by METAL and STATA [32-35].
- Functional analyses
Different types of functional analyses can be performed on the identified SNPs, Such as: Electrophoretic Mobility Shift Assay or EMSA and Lucifer Reporter Assay. EMSA allows us to assess the existence of different proteins/transcription factors and their binding with DNA segments constituting our SNPs. Luciferase Reporter Assay tells whether, the associated SNPs have any effect upon gene expression or not. These are gold standard techniques for validating GWAS [36].
- Other Analyses
A variety of other analyses can be performed upon the GWAS outcome, each being significant in its own way, examples include: SNP based analysis, Pathway based analysis [37], SNP by SNP interaction, SNP by environment interaction and Polygenic Risk Estimation [38, 39].
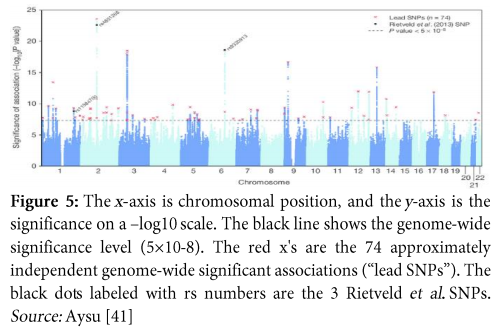
Example
Consider an example of GWAS conducted with the hypothesis based upon educational attainment. The results of this study depict 74 chromosomal loci which have significant association with educational attainment. So, this study provided another proof that educational attainment is not only based upon social and environmental factors but, genetics also play a significant role in influencing it. It suggested that, SNPs associated with educational attainment are excessively located in those regions of genome which control regulation of gene expression in the fetal brain. Moreover, the information acquired from this study is that: GWAS, if conducted with great care, has capability of providing an idea about the influence of genetic factors on environmentally controlled behavioural phenotypes. Figure 5 shows association of SNPs with educational years where, the x-axis consists of chromosomal locations and the y-axis represents significance of study on -log 10 scale [40].
Applications
Applications of genome wide association studies are mainly in field of diagnostics and pharmacogenomics, in such a huge number that it becomes essential to categorize them under the following main headings:
- Determination of physiology and classification of disease
- Development of target specific treatment strategies
- Direct treatment selection
- Aid in dosing and monitor drug adverse effects
- Disease prediction/ indication of more intensive screening
- Indication of more intensive environmental modifications
Thus, GWASs play vital role in disease prevention, diagnosis, better care and personalized medicine.
Conclusion![]()
A considerable revolution has been made in the field of genomic research due to swiftly upgrading genome-wide association study approach. This approach has been successful in identifying numerous significant genomic variants, having associations with multiple human phenotypic traits and disorders. But, identification of associations having clinical significance is still a big challenge for GWAS. In next few years, it is expected that sequencing techniques would become cheaper and advancements in bioinformatics would lead to better data management, analysis, storage and quality control thereby, leading to better understanding of genotype-phenotype association in future. Much improvement has been made through this technique in different diseases such as, psychological illnesses, cardiac disorders, oncogenesis, diabetes and asthma. GWASs are laying foundation for an era in which personalized medicine would be more common and pharmacogenomics would have more strength. Although, genome wide association studies have proven to be successful in identifying significant trait/disease associations SNPs, but the issue of missing heritability and lack of thorough genomic information still demands better evaluation for its validation.
Conflict of Interest Statement
The authors declare that they have no competing interests.
References![]()
- International HapMap Consortium. A haplotype map of the human genome. Nature, (2005); 437(7063): 1299-320.
- International HapMap Consortium, Frazer KA, Ballinger DG, Cox DR, Hinds DA, Stuve LL, et al. A second-generation human haplotype map of over 3.1 million SNPs. Nature, (2007); 449(7164): 851-61.
- International HapMap 3 Consortium1, Altshuler DM, Gibbs RA, Peltonen L, Dermitzakis E, Schaffner SF, et al. Integrating common and rare genetic variation in diverse human populations. Nature. (2010); 467(7311): 52-8.
- Bush WS, Moore JH. Genome-wide association studies. PLoS Computational Biology, (2012); 8(12): e1002822.
- Hirschhorn JN, Daly MJ. Genome-wide association studies for common diseases and complex traits. Nature Reviews Genetics, (2005); 6(2):95-108.
- Lee SH, Wray NR. Novel genetic analysis for case-control genome-wide association studies: quantification of power and genomic prediction accuracy. PLoS One, (2013); 8(8): e71494.
- Yang J, Wray NR, Visscher PM. Comparing apples and oranges: equating the power of case-control and quantitative trait association studies. Genetic Epidemiology, (2010); 34(3): 254-7.
- Ragoussis J. Genotyping technologies for genetic research. Annual Review of Genomics and Human Genetics, (2009); 10: 117-33.
- Distefano J, Taverna D. Technological issues and experimental design of gene association studies. Methods in Molecular Biology, (2011); 700: 3-16.
- Madore A, Laprise C. Immunological and genetic aspects of asthma and allergy. Journal of Asthma Allergy, (2010); 3: 107-21.
- Hanke C, Waide S, Kettler R, et al. Monitoring induced gene expression of single cells in a multilayer microchip. Analytical and Bioanalytical Chemistry, (2012); 402(8): 2577-2585.
- Trevino V, Falciani F, Barrera-Saldaña HA. DNA microarrays: a powerful genomic tool for biomedical and clinical research. Molecular Medicine, (2007); 13(9-10): 527-41.
- Reed E, Nunez S, Kulp D, Qian J, Reilly MP, Foulkes AS. A guide to genome-wide association analysis and post-analytic interrogation. Statistics in Medicine, (2015); 34(28): 3769-92.
- Purcell S, Neale B, Todd-Brown K, Thomas L, Ferreira MA, Bender D, et al. PLINK: a tool set for whole-genome association and population-based linkage analyses. American Journal of Human Genetics, (2007); 81(3): 559-75.
- Howie B, Donnelly P, Marchini J. A flexible and accurate genotype imputation method for the next generation of genome-wide association studies. PLoS Genetics, (2009); 5(6): e1000529.
- DataPre-processing, http://www.stat-gen.org/tut/tut_preproc.html, 9-05-2019.
- Ikram M, Sim X, Xueling S, Jensen R, Cotch M, Hewitt A, et al. Four novel Loci (19q13, 6q24, 12q24, and 5q14) influence the microcirculation in vivo. PLoS Genetics, (2010); 6(10): e1001184.
- Nakajima M, Takahashi A, Kou I, Rodriguez-Fontenla C, Gomez-Reino J, et al. New Sequence Variants in HLA Class II/III Region Associated with Susceptibility to Knee Osteoarthritis Identified by Genome-Wide Association Study. PLoS ONE, (2010); 5(3): e9723.
- Husby A, Kawakami T, Ronnegard L, Smeds L, Ellegren H, Qvarnstrom A. Genome-wide association mapping in a wild avian population identifies a link between genetic and phenotypic variation in a life-history trait. Proceedings of the Royal Society B: Biological Sciences, (2015); 282(1806): 20150156.
- Evangelou E, Ioannidis JP. Meta-analysis methods for genome-wide association studies and beyond. Nature Reviews Genetics, (2013); 14(6): 379-89.
- Willer CJ, Li Y, Abecasis GR. METAL: fast and efficient meta-analysis of genome wide association scans. Bioinformatics, (2010); 26(17): 2190–2191.
- Chaimani A, Mavridis D, Salanti G. A hands-on practical tutorial on performing meta-analysis with Stata. Evidence-Based Mental Health, (2014); 17: 111-116.
- Sanna S, Jackson AU, Nagaraja R, Willer CJ, Chen WM, et al. Common variants in the GDF5-UQCC region are associated with variation in human height. Nature Genetics, (2008); 40: 198–203.
- Willer CJ, Sanna S, Jackson AU, Scuteri A, Bonnycastle LL, et al. Newly identified loci that influence lipid concentrations and risk of coronary artery disease. Nature Genetics, (2008); 40: 161–169
- Nishizaki SS, Boyle AP. Mining the Unknown: Assigning Function to Noncoding Single Nucleotide Polymorphisms. Trends in Genetics, (2016); 33(1): 34–45.
- Cirillo E, Kutmon M, Gonzalez Hernandez M, Hooimeijer T, Adriaens ME, Eijssen LMT, et al. From SNPs to pathways: Biological interpretation of type 2 diabetes (T2DM) genome wide association study (GWAS) results. PLoS One, (2018); 13(4): e0193515.
- Zollanvari A, Alterovitz G. SNP by SNP by environment interaction network of alcoholism. BMC Systems Biology, (2017); 11(3): 19.
- Lin WY, Huang CC, Liu YL, Tsai SJ, Kuo PH. Polygenic approaches to detect gene-environment interactions when external information is unavailable. Briefings in Bioinformatics, (2018). 10.1093/bib/bby086.
- Hernández F, Ávila J. Commentary: Genome-wide association study identifies 74 loci associated with educational attainment. Frontiers in Molecular Neuroscience, (2017); 10: 23.
- Okbay A, Beauchamp JP, Fontana MA, et al. Genome-wide association study identifies 74 loci associated with educational attainment. Nature, (2016); 533(7604): 539–542.
![]()
This work is licensed under a Creative Commons Attribution-Non Commercial 4.0 International License. To read the copy of this license please visit: https://creativecommons.org/licenses/by-nc/4.0