
Full Length Research Article
Detection of Endothelin 2 (Et-2) as a novel biomarker of renal dysfunction in patients of liver Cirrhosis with Ascites
Amna Qureshi1, Kalsoom Zaigham1, Muhammad Shahzad Iqbal2,*, Qurban Ali2
Adv. life sci., vol. 3, no. 4, pp. 112-118, August 2016
*– Corresponding Author: Muhammad Shahzad Iqbal (Email: shahzad.iqbal@cemb.edu.pk)
Authors' Affiliations
2- Centre of Excellence in Molecular Biology, University of the Punjab Lahore – Pakistan
Abstract![]()
Introduction
Methods
Results
Discussion
References
Abstract
Background: Hepatorenal dysfunction in liver cirrhosis is a condition in which there is progressive kidney failure. It is a serious complication that can lead to death. Endothelin is an endothelial cell-derived peptide which is involved in renal dysfunctioning by generating oxidative stress in individuals suffering from liver cirrhosis. It can be used as important biomarker of hepatorenal dysfunction. The present study was aimed to detect endothelin-2 in the blood of patients of liver cirrhosis with ascites as important biomarker correlated to the generation of oxidative stress and renal dysfunctioning.
Methods: 50 blood and ascitic fluid samples were collected from the patients of liver cirrhosis with ascites as case group and 25 from normal individuals as control group. Endothelin-2 was detected by PCR in serum and ascetic fluid of patients and its quantification was done by Real-time PCR. ET-2 was quantified in serum samples but was not quantifiable in ascetic fluid might be due to its very low concentration. Blood urea, creatinine and uric acid with GFR were estimated as renal dysfunction parameters. Anti-oxidative enzymes glutathione (GSH), catalase (CAT), superoxide dismutase (SOD) and malondialdehyde (MAD) as biomarkers of oxidative stress were estimated in order to calculate oxidative stress. The obtained data was evaluated statistically by using t-test and Pearson correlation.
Results: Positive correlation was found between individual parameters of oxidative stress and renal dysfunction. Overall positive and highly significant (P<0.05) correlation of CAT, SOD, MDA, GSH levels with each other was observed, a significant (P<0.05) and positive correlation of oxidative stress parameters were found with urea, creatinine and uric acid with Glomerular filtration rate (GFR).
Conclusions: It was concluded that the production of ET-2 under oxidative stress generates renal dysfunction in patients of liver cirrhosis with ascites.
Keywords: Endothelin, Creatinine, Ascitic fluid, Glutathione, catalase, Superoxide dismutase, Malondialdehyde
Introduction
Renal failure (RF) is a challenging complication of liver cirrhosis. It is associated with a high morbidity and mortality in patients suffering from liver disease. Its incidence is 30% in liver cirrhosis with infections, 11% in upper GI bleed and 45 – 50% in critically ill liver cirrhosis patients admitted to intensive care units [1]. Endothelial dysfunction and the bioavailability of nitric oxide (NO) have been documented as one of many risk factors for renal problems [2]. Endothelin is a group of effective vasoconstrictors peptides that are released from vascular endothelial cells and behave as autocrine or paracrine regulators. The endothelin system is necessary for maintenance of normal blood pressure and regulation of vascular tone. There are three isoforms of endothelin, endothelin-1 (ET-1), endothelin-2 (ET-2), endothelin-3 (ET-3) which are produced in several tissues to carry out vasomotor tone, cell proliferation, and hormone production [3, 4]. ET-2 is present abundantly in kidney and intestine, while a small amount is also observed in myocardium cells, placenta, and uterus [5].
Endothelin performs its action through its receptors: (ETA) and (ETB) receptors. These receptors are G protein coupled transmembrane proteins with different molecular and pharmacological characteristics [6, 7]. Endothelin peptide with 31 amino acids has been identified in humans, formed through the cleavage of the big endothelin-1 between the Tyr31 and Gly32 amino acids by a human chymase enzyme expressed in mast cells [8].
The overall function of endothelin is to increase blood pressure and vascular tone [9]. Endothelins are proteins that constrict blood vessels. They are normally kept in balance by other mechanisms; however, when they are ove rexpressed, they contribute to high oxidative stress and renal disease. ET production is stimulated in a variety of different cell types under the influence of risk factors for vascular stress leading to renal dysfunction In patients of liver cirrhosis with ascites there is induced production of oxidative stress with the production of endothelins. Portal hypertension is produced due to vasoconstriction. Splanchnic vascular and peripheral arterial vasodilation takes place which generates nitric oxide (NO overproduction). In cirrhosis arteriolar vasodilation causes under filling systemic arterial vascular space. This event, a decrease in effective blood volume leads to a drop in arterial pressure which consequently affects glomerular filteration rate in kidneys altering renal functions [3].
Keeping in view the role of endothelin 2 in generating renal complications in liver cirrhosis, the present study was conducted to estimate Endothelin-2 as a novel biomarker of cardiovascular stress in patients with liver cirrhosis.
Methods
Total 50 samples of Human sera and ascitic fluid were obtained from patients of liver cirrhosis with ascites from General Hospital Lahore Pakistan, after approval of the protocol by the Ethics Review Committee of hospital, along with blood samples of normal individuals. Blood samples were processed to get serum by centrifugation at 3000 rpm for 10 minutes. All the samples were stored at -20oC until further use. 25 samples of blood and 25 ascetic fluids were taken from the patients of liver cirrhosis with ascites randomly. 25 blood samples were collected from normal individuals. The samples were processed and analyzed for the detection of ET-2, SOD, GSH, CAT, MDA and NO. Blood urea, creatinine and uric acid with GFR were estimated as renal dysfunction parameters. Patients with hypertension, diabetes, CVD, and pregnant women were excluded from the study.
Detection of ET-2 by Genotyping of serum and ascitic fluid
A multiplex PCR was employed to genotype the serum and ascitic fluid specimen. RNA was extracted from serum and ascitic fluid samples by using RNA isolation Kit Cat No: FAVK001-2 provided by Favorgen Biotech Corp, according to the kit protocol with little modification. 570 μl of VNE (carrier RNA added) was added to the serum and ascitic fluid samples, after vortexing incubated for 10 minutes at room temperature 570 μl of ethanol (96-100%) was transferred to samples. 500 μl of wash buffer 1 (ethanol) was added to VNE column, and was centrifuged at 8000rpm for 1 minute. Then 50 μl of wash buffer 2 (ethanol added) was added to VNE column and was centrifuged at 8000rpm for 1 min before discarded the flow-through. Whole sample mixture was centrifuged at full speed 13,000 rpm for 1 minute. 50 μl of RNase-free water was transferred to membrane center of VNE column to elute nucleic acid from collection tubes after centrifugation at 10,000 rpm for 2 minutes and nucleic acid was stored at -70oC.
Amplification conditions
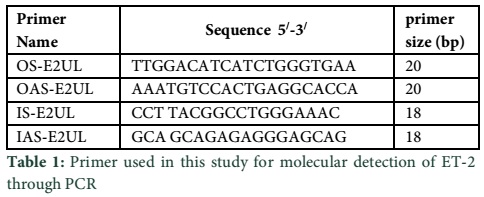
For ET-2, primers were designed by primer 3 software (Table 1). After reconstitution of primers PCR reaction was carried out in thermal cycler with Taq DNA polymerase (5U). The amplification was performed with 2 μl of cDNA by using 7.8 μl first round PCR mix. 8 μl reaction mixture was added to form 10 μl total reaction. Cycling condition for amplification of ET-1 and ET-2 was kept same. With 35 cycles at 50 oC 7 μl Mix 2 of ET-1, 1μl taq (2U) and 2 μl of template was carried out. In 2nd Round of Amplification of ET-3 7.8 μl Mix 2 of ET-3, 0.2 μl Taq (5U) and 2 μl of template was added and reaction was carried at 54 with 35 cycles. Detection of PCR amplification products (ET-1 and ET-3) was detected on 2% agarose gel.
Quantification of ET-2
Reaction mixture was prepared by adding 12.5 μl SYBET Green, 2.5 μl, Forward Primer 10 (pm/μl), 2.5 μl Reverse Primer, 2.5 μl water (nuclease-free) and 5μl cDNA. Master mix was mixed thoroughly. For ET-2 in Stage 1 at 95oC for 600 seconds and in stage 2:3 95.0oC for 15 seconds, 50.0oC for 30 seconds and 72.0oC for 30 seconds, thermal conditions were applied.
Estimation of MDA through standard curve by using Thiobarbituric acid (TBARS)
Thiobarbituric acid reactive substance was used for estimation of MDA level in serum and ascitic fluid. 1 ml of both samples was taken and a 10% (w/v) homogenate was prepared in 10 mM buffer (pH 7.4). The supernatant was used for immediate thiobarbituric acid reactive substances. In this test 200 µl of serum sample, 200 µl of 8.1% sodium dodecyl sulfate (SDS), 1.5 ml of 0.8% TBA, 1.5 ml of 20% acetic acid solution (pH 3.5) 4.0 ml distilled water and 5.0 ml of n-butanol were used. Its absorbance at 532 nm was recorded.
Estimation of SOD, catalase and glutathione activity through standard curve
Serum and ascitic fluid were taken and homogenate was prepared in 50% TCA and centrifuged at 13000 rpm. The supernatant was used for immediate SOD and other enzyme activity evaluation. In this test 100 µl of serum sample,1.2 ml of sodium phosphate buffer (pH 8.3, 0.052M),100 µl of phenazinemethosulphate (186µm), 300 µl of nitro blue tetrazolium (300 µm), 200 µl of NADH (750 µm) and 4.0 ml of nbutanol were used. Reaction was started by addition of NADH. .Its absorbance at 560 nm was recorded against butanol. All procedure for estimation of antioxidant enzyme superoxide dismutase was performed in ice bath. Catalase activity was measured by the method earlier described by Aebi [10]. 1 ml of serum and ascitic fluid was taken and a 10% (w/v) homogenate was prepared in 10 mM buffer (pH 7.4) and was centrifuged at 13,000 rpm for 10 minutes at 4. The supernatant was used for the estimation of CAT. 100 µl of supernatant and 1.9 ml of 50mM phosphate buffer and freshly prepared 30 mM H2O2 were used. The rate of decomposition of H2O2 was measured spectrophotometer at 240 nm. Activity of catalase was expressed as unit/ml of protein. 0.1 ml of both samples (serum and ascitic fluid) was added in test tubes. 2.4 ml of 0.02M EDTA was added in each test tube and was kept in ice bath for 10 minutes. Then 2.0 ml of dH2O (distilled water) was added in each test tube. After addition of dH2O 0.5 ml 50% TCA was added in each test tube and was again kept in ice bath for 10-15 minutes. The mixture was centrifuged at 3000-3500 rpm for 10 minutes. 1.0ml supernatant was taken in separate tubes and 2.0 ml 5 M Tris HCl and 0.05 ml DTNB was added. The mixture was vortexed and absorbance was taken after 2-3 minutes at 412 nm. The absorbance was compared with standard curve generated by the known GSH level. The GSH was measured in µg/ml.
Estimation of renal parameters
Creatinine in Serum
Creatinine estimation was done by buffered kinetic Jaffe reaction without deproteization [11]. Concentration of creatinine was calculated as follows;
Creatinine (mg/dl) = (A sample / A standard) × 2.
The normal reference value of creatinine in serum, plasma is 0.2-1.2 mg/dl.
Estimation of urea in serum
Urea was estimated in serum of patients through Randox enzymatic kit method [12]. Concentration of urea was calculated as follows
Urea (mg/dl) = (A sample / A standard) × 40
The normal reference value of urea in serum, plasma is 14-40 mg/dl
Estimation of uric acid in serum
Uric acid was estimated through Randox enzymatic kit method [13]. Concentration of uric acid in serum was calculated as follows;
Concentration of uric acid in serum (mg/dl) = (A sample / A standard) × 10 and normal reference value in serum / plasma (males): 3.4 – 7.0 mg/dl, and in females: 2.5-6.0 mg/dl.
Estimation of GFR
GFR in male = (140 – age) × mass (kg) × 1.23 / Serum creatinine (µmol/ l)
GFR in female = (140 – age) × mass (kg) × 1.04 / Serum creatinine (µmol/ l)
Normal reference value: 100 – 130 ml/min/1.73m2
Statistically designing and data analysis
The obtained data was evaluated statistically by using t-test and Pearson correlation.
Results
Detection of ET-2
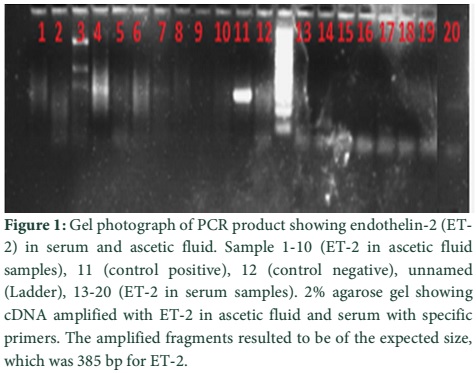
Total 25 samples of blood and 25 ascitic fluid were taken from patients of liver cirrhosis with ascites. RNA was extracted from blood and ascitic fluid, cDNA synthesis, and PCR amplification of ET-2 gene was done and bands were detected in samples of ascitic fluid and serum.
Detection of ET-2 in blood and ascetic fluid
The amplified fragments resulted to be of the expected size, which was 385 bp for ET-2 (Figure 1).
Quantification of ET-2 gene in serum and ascitic fluid
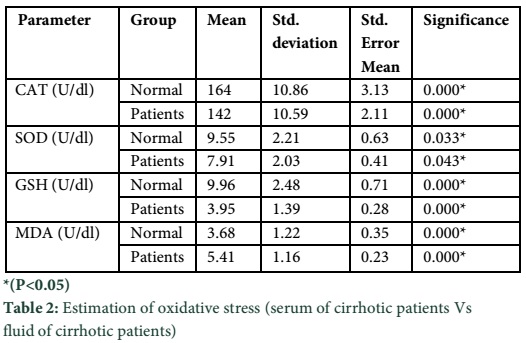
ET-2 was quantified in serum samples but was not quantifiable in ascetic fluid might be due to its very low concentration. ET-2 in serum samples was quantified at Ct= 295.5, 33.30, 34.63. Amount of ET-2 was calculated by WHO standards amounting 59726.7 cps/μl, 4311.9 cps/μl and 315.9 cps/μl. The mean value of serum catalase (U/dl) level in normal individuals was recorded as 164±10.86 and 142±10.59 in patients of liver cirrhosis with ascites (Table 2). Significant (P<0.05) reduced level of serum catalase was observed in patients of liver cirrhosis as compared to control group. Mean SOD (U/dl) levels in normal individuals were measured as 9.55±2.21 while in patients of liver cirrhosis with ascites it was assessed as 7.91±2.03. The SOD levels were significantly decreased (P<0.05) in patients of liver cirrhosis with ascites as compared to control group. Significant decreased levels (P<0.05) of GSH were observed in patients of liver cirrhosis with ascites 3.96±1.39 as compared to control group 9.96±2.48. MDA (U/dl) levels in patients of liver cirrhosis with ascites were observed as 5.41±1.16 as compared to control group 3.68±1.22. The MDA levels were significantly increased (P<0.05) in patients as compared to control group.
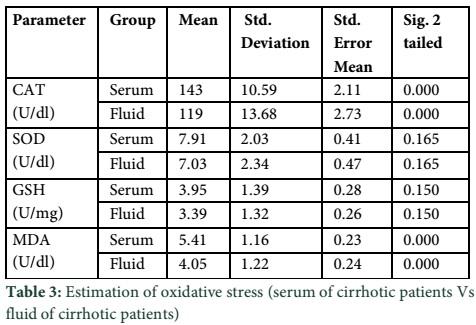
The mean values of Catalase (U/dl) in serum and ascetic fluid of patients were evaluated as 143±10.59 and 119±13.69 respectively (Table 3). The significant increased (P<0.05) catalase level was observed in serum as compared to ascetic fluid of patients of liver cirrhosis with ascites. The insignificantly elevated mean values (P>0.05) of SOD (U/dl) were observed as 7.91±2.03 in serum as compared to ascetic fluid 7.03±2.349. The mean values of GSH (U/dl) in patient’s serum were estimated as 3.95±1.39 and where in ascetic fluid it was 3.39±1.32. Insignificant difference was observed in GSH levels in serum as compared to ascetic fluid of patients of liver cirrhosis with ascites. The MDA (U/dl) levels in serum patients were observed as 5.41±4.05 as compared to ascetic fluid of patients 4.05±1.22. The MDA levels were significantly (P<0.05) elevated in serum as compared to ascetic fluid.
Estimation of Renal Parameters
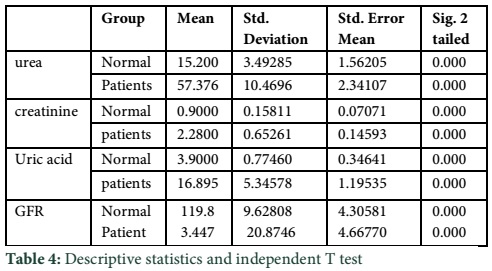
According to descriptive statistics the mean values of urea in control and renal failure patients were ±15.2 and ±57.37 respectively (Table 4). The observed mean values of creatinine in control group were ± 0.90 while in renal failure patients were ±2.28. Similarly uric acid in control group was observed ± 3.90 while in renal failure patient. The observed mean values of uric acid in renal failure patients were ±16.89. The observed mean values of GFR in control group were ±119.8 while in renal failure patients were ±53.44. According to independent T test, overall significant difference was observed in all the renal parameters (Urea, Creatine, Uric acid and GFR) of renal failure patients as compared to control group.
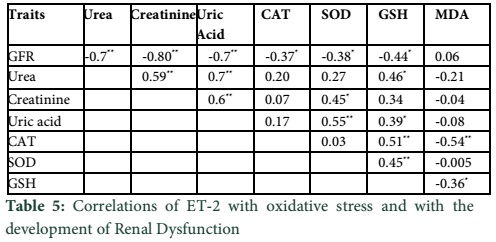
By using Pearson correlation (Table 5), the significant positive (P<0.05) correlation was obtained in urea with creatinine (r =0.58) and uric acid(r =0.70). Creatinine is positively correlated with urea (r =0.50) and uric acid (r =0.45) and it is significantly correlated with only sod (r =0.54) among oxidative stress parameters. Uric acid is significantly correlated with urea (r = 0.65) and creatinine (r = 0.45). GFR is significantly correlated with urea (r = -0.67), creatinine (r = -0.79) and uric acid (r = -0.67). GFR is highly significant with parameters of oxidative stress (SOD, CAT, GSH) and insignificant with (MDA). Catalase is significantly positively correlated with GSH (r = 0.51) and negatively correlated (significant) with MDA (r = -0.54). SOD is significantly correlated with creatinine (r =0.54) and with GSH (r= 0.45). GSH is positively correlated with catalase(r =0.51) and SOD (r = 0.45), and negatively correlated with MDA (r = -0.36). MDA is negatively correlated with catalase (r =-0.54) and GSH (r = -0.35).
Tables & Figures
Discussion
The present study was designed to elucidate the role of endothelin 2 in renal dysfunction. Oxidative stress was measured in serum and ascitic fluid of patients of liver cirrhosis with ascites. The outcomes of CAT, GSH, SOD and MDA showed significant (P<0.05) differences in CAT, GSH, SOD and MDA levels in serum of patients of liver cirrhosis with ascites as compared to control group which was correlated with the work [14] in which significant difference of CAT, GSH, SOD and MDA level were observed in cirrhotic patients. Due to excessive ROS generation, body anti-oxidative defense mechanism gets activated to neutralize the ROS. As a result of anti oxidative defense mechanism, the level of GSH, CAT and GSH gets decreased while MDA is increased which signifies lipid per oxidation [15].
Analysis of oxidative stress in serum and ascetic fluid of patients of liver cirrhosis showed significantly (P<0.05) elevated levels of catalase in serum of patients as compared to ascitic fluid of patients liver cirrhosis with ascites. Insignificant (P>0.05) difference in SOD and GSH was observed in serum as compared to fluid of patients. Elevated levels of catalase and MDA in serum as compared to the ascitic fluid of patients was may be due to less conversion of hydrogen peroxide into water and oxygen while insignificant MDA levels could be due to less lipid peroxidation and tissue is more susceptible to oxidative damage [16]. The findings were in line with work in which significant difference in anti-oxidative enzymes and MDA were obtained in liver cirrhosis [17]. For the estimation of renal dysfunction, urea, creatinine and uric acid were assessed in serum while GFR was calculated through formula. The results showed significant (P<0.05) difference in urea creatinine, uric acid and GFR levels in patients as compared to normal individuals [18].
Correlation of all renal parameters with oxidative stress parameters were also measured by Pearson correlation. Correlation was determined between oxidative stress parameters and renal indices. Correlation among the individual parameters of oxidative stress, showed positive and highly significant (P<0.05) correlation of CAT, SOD, MDA, and GSH levels with each other and with renal indices (urea, creatinine and uric acid) and insignificant difference with GFR. The findings were in line with work [19] in which significant difference in renal indices were obtained. In short, the present study speculates that increased production of ET-2 during vascular stress generated in patients of liver cirrhosis with ascites leads to the development of severe renal dysfunction. ET-2 was detected in both serum and ascitic fluid of patients but it was not in significant amount to be quantified in serum and ascitic fluid of patients. But keeping in view the present study, As ET-2 was detected in both serum and ascitic fluid so, ET-2 can be considered as important key factor in the development of Renal dysfunction in patients of liver cirrhosis with ascites by the generation and provocation of oxidative stress in disease condition [20]. Considering the potentially important role of ET-2 in the development of renal dysfunction in patients of liver cirrhosis with ascites, further study can be conducted to develop Endothelin receptor antagonists. To avoid the complication related to ET and to treat endothelial dysfunctioning, liver toxicity and other complications related to renal diseases.
It was concluded from the outcomes of the present study that production of ET-2 in oxidative stress generated during liver cirrhosis which is an indicator of renal dysfunction in patients of liver cirrhosis and ascites. As oxidative stress is malevolent process that can be an important negotiator of damage to cell structures and consequently leads to various disease states and ageing. So, ET-2 can be considered as an important novel biomarker of renal dysfunction in patients of liver cirrhosis with ascites. It was concluded from the outcomes of the present study that production of ET-2 in oxidative stress generated during liver cirrhosis which is an indicator of renal dysfunction in patients of liver cirrhosis and ascites. As oxidative stress is malevolent process that can be an important negotiator of damage to cell structures and consequently leads to various disease states and ageing. So, ET-2 can be considered as an important novel biomarker of renal dysfunction in patients of liver cirrhosis with ascites.
References
- Qureshi MO, Shafqat F, Dar FS, Salih M, Khokhar N. Renal failure in patients with end stage liver disease and its impact on clinical outcome. Journal of the College of Physicians and Surgeons–Pakistan, (2014); 24628-631.
- Ginès P, Schrier RW. Renal failure in cirrhosis. New England Journal of Medicine, (2009); 361(13): 1279-1290.
- Arroyo V, Terra C, Ginès P. Advances in the pathogenesis and treatment of type-1 and type-2 hepatorenal syndrome. Journal of Hepatology, (2007); 46(5): 935-946.
- Loomis ED, Sullivan JC, Osmond DA, Pollock DM, Pollock JS. Endothelin mediates superoxide production and vasoconstriction through activation of NADPH oxidase and uncoupled nitric-oxide synthase in the rat aorta. Journal of Pharmacology and Experimental Therapeutics, (2005); 315(3): 1058-1064.
- Böhm F, Pernow J. The importance of endothelin-1 for vascular dysfunction in cardiovascular disease. Cardiovascular Research, (2007); 76(1): 8-18.
- Agapitov AV, Haynes WG. Role of endothelin in cardiovascular disease. Journal of Renin-Angiotensin-Aldosterone System, (2002); 3(1): 1-15.
- Arroyo V, Ginès P, Gerbes AL, Dudley FJ, Gentilini P, et al. Definition and diagnostic criteria of refractory ascites and hepatorenal syndrome in cirrhosis. Hepatology, (1996); 23(1): 164-176.
- Elmarakby AA, Loomis ED, Pollock JS, Pollock DM. NADPH oxidase inhibition attenuates oxidative stress but not hypertension produced by chronic ET-1. Hypertension, (2005); 45(2): 283-287.
- Zaigham K, Muneer MT, Iqbal MS, Hafeez MN, Ali Q. Evaluation of oxidative stress association with chronic kidney disease. . New York Science Journal, (2015); 8(3): 88-92.
- Aebi H. Catalase in vitro. Methods in Enzymology, (1984); 105121-126.
- Tobias GJ, McLaughlin Jr RF, Hopper Jr J. Endogenous creatinine clearance: a valuable clinical test of glomerular filtration and a prognostic guide in chronic renal disease. New England Journal of Medicine, (1962); 266(7): 317-323.
- Wybenga DR, Di Giorgio J, Pileggi VJ. Manual and automated methods for urea nitrogen measurement in whole serum. Clinical Chemistry, (1971); 17(9): 891-895.
- Fossati P, Prencipe L, Berti G. Use of 3, 5-dichloro-2-hydroxybenzenesulfonic acid/4-aminophenazone chromogenic system in direct enzymic assay of uric acid in serum and urine. Clinical Chemistry, (1980); 26(2): 227-231.
- Floreani M, Petrone M, Debetto P, Palatini P. A comparison between different methods for the determination of reduced and oxidized glutathione in mammalian tissues. Free Radical research, (1997); 26(5): 449-455.
- Kakkar P, Das B, Viswanathan P. A modified spectrophotometric assay of superoxide dismutase. Indian J Biochem Biophys, (1984); 21(2): 130-132.
- Aramori I, Nakanishi S. Coupling of two endothelin receptor subtypes to differing signal transduction in transfected Chinese hamster ovary cells. Journal of Biological Chemistry, (1992); 267(18): 12468-12474.
- Geetha S, Rao CR, Vijayan M, Trivedi D. Biosensing and drug delivery by polypyrrole. Analytica Chimica Acta, (2006); 568(1): 119-125.
- Tomlanovich S, Golbetz H, Perlroth M, Stinson E, Myers BD. Limitations of creatinine in quantifying the severity of cyclosporine-induced chronic nephropathy. American Journal of Kidney Diseases, (1986); 8(5): 332-337.
- Wilkes LC, Boarder MR. Characterization of endothelin receptors on a human neuroblastoma cell line: evidence for the ETA subtype. British Journal of Pharmacology, (1991); 104(3): 750-754.
- Ohkawa H, Ohishi N, Yagi K. Assay for lipid peroxides in animal tissues by thiobarbituric acid reaction. Analytical Biochemistry, (1979); 95(2): 351-358.