

Full Length Research Article
Genetic diversity and phylogenetic relationship in different genotypes of cotton for future breeding
Jehan Bakht1*, Marina Iqbal1, Mohammad Shafi2
Adv. life sci., vol. 5, no. 1, pp. 25-29, November 2017
*– Corresponding Author: Jehan Bakht (Email: jehanbakht@yahoo.co.uk)
Authors' Affiliations
2. Department of Agronomy, The University of Agriculture Peshawar – Pakistan
Abstract![]()
Introduction
Methods
Results
Discussion
References
Abstract
Background: To make the plants well adapted and more resistant to diseases and other environmental stresses there is always a need to improve the quality of plant’s genome i.e. to increase its genetic diversity.
Methods: In the present study six variety and six lines of cotton were investigated for their genetic diversity and phylogenetic relationship. For this purpose 35 different RAPD primers obtained from the Gene Link Technologies, USA were used.
Results: Among 35 RAPD primers, 13 primers produced reproducible PCR bands while the rest failed to show any amplification product. Our results indicated that the total count of the reproducible bands was 670 and polymorphic loci were counted to be 442 which constitute 66% of total loci. Phylogenetic analysis revealed two major groups each consists of 7 and 5 genotypes respectively. Genotypes Lp1 and Tp4 were placed at maximum genetic distance and in separate groups and could be utilized for future cotton breeding.
Conclusions: RAPD analysis is a cheaper and time saving technique for the determination of genetic diversity of different cotton genotypes. Cotton genotype Lp1 and Tp4 could be the best candidates for future breeding programs as both genotypes are genetically distant from each other.
Key words: Genetic diversity, phylogenetic relationship, cotton, PCR, RAPD
Introduction
Cotton botanically known as Gossypium hirsutum L. holds a significant place in the global market. Due to its economic importance cotton crop is produced all over the world and is thus a source of income to millions of people from its cultivation through processing and production to its consumption [1]. Cotton grown in different regions shows very less genetic difference [2]. A narrow genetic background itself poses a threat to the survival of a plant as it makes the plant vulnerable to environmental changes and natural catastrophes. Therefore to make the plants well adapted and more resistant to diseases and other environmental stresses there is always a need to improve the quality of plant’s genome i.e. to increase its genetic diversity. Researchers throughout the world are therefore trying for many years to establish varieties which display a wide genetic base. For this purpose genetic studies are being carried out to gather greater amount of information about the genome and genetic diversity of cotton and then to utilize the gathered information for the improvement of the crop’s genetic base and development of improved and more adapted varieties. It is also very crucial for the conservation and maintenance of existing gene pool and the relatedness among members of that gene pool that the genome of that crop be well studied[3].Molecular markers are valuable tools in the characterization and evaluation of genetic diversity among different species and population. It has been reported that different markers revealed different classes of variation [4-11].
Different molecular markers are routinely used for the characterization and evaluation of genetic diversity in different plant species and population [12, 13]. RAPD (Randomly amplified polymorphic DNA) which is a PCR based marker has many advantages including readily being used, requiring minute amount of genomic DNA, does not need blotting and radioactive detection etc. DNA finger prints can be generated with Random Amplified Polymorphic DNA (RAPD). RAPD markers are based on the amplification of unknown DNA sequences using single, short and random oligonucleotide sequences of arbitrary nature as primers [14]. RAPD does not need any prior knowledge of DNA sequence, however, still reveals a high level of polymorphism. RAPD PCR is currently used as a tool for the assessment of genetic variability between genotypes in breeding programs. Keeping in view the role of RAPD markers in the determination of genetic diversity, the present study was carried out to determine genetic diversity among different genotypes of cotton using RAPD markers and selection of genetically diverse genotypes for future breeding programs.
Methods
Plant material
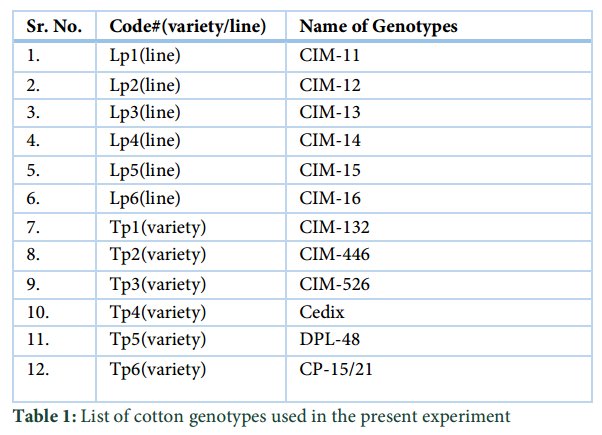
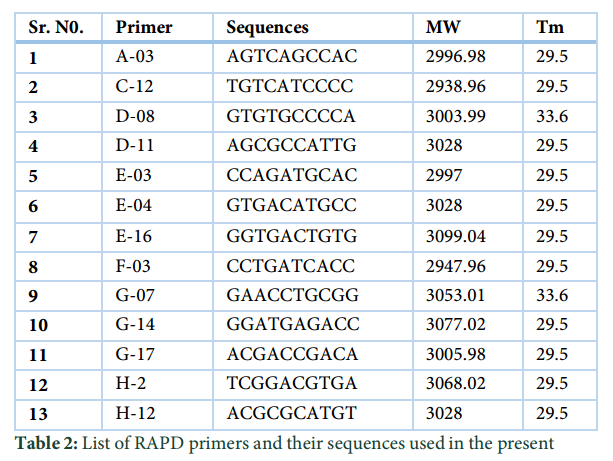
Genetic diversity of twelve cotton lines/ cultivars obtained from Cotton Research Institute Multan Pakistan (Table 1) using RAPD primers were studied at the Institute of Biotechnology and Genetic Engineering, University of Agriculture Peshawar. For this purpose plants from different cotton genotypes were raised in pots at the green house. At four leaf stage, leaves were collected, homogenized in liquid nitrogen for DNA extraction. PCR was performed with different RAPD primers (Table 2).
DNA extraction
DNA from leaves was extracted using 2% CTAB buffer. About 500 mg of leaves samples was crushed with pestle and mortar into fine powder and then mixed with 1.25 ml 2% CTAB. The samples were transferred to an Eppendorf tube and incubated at 600C for 60 minutes. After incubation, chloroform and isoamyl alcohol (24:1) was added to each and mixed thoroughly through inversion and centrifuged at 14000 rpm for 15 minutes. The supernatant was transferred to a new Eppendorf tubes and 0.6 volumes of 2-propanol was added and centrifuged at 12000 rpm for 10 minutes. The pellet of each sample was washed with 70% ethanol and left for drying at room temperature for 15 minutes. To remove RNA, the samples were treated with 40 µg RNAse enzyme A at room temperature for one hour. DNA was re-extracted as described earlier. DNA pellets were dried, dissolved in 50 µl TE buffer and stored at -80 0C until used. Before PCR, concentration of DNA and protein was determined by spectrophotometer using 260nm and 280 nm [15].
Polymerase chain reaction
PCR reaction was performed using the methods of Devos and Gale [16] with some necessary modifications. For the determination of genetic diversity of cotton genotypes, RAPD decamers obtained from Gene Link Technologies, USA, were utilized. PCR was performed in a 25 µl reaction that consisted of about 50-100 ng of DNA template (0.5 micro-liter from the total dissolved DNA in this case), 1 µl of primer (0.25 micro-mol), 2.5 µl PCR mix (500 mM KCI, l00mM Tris-HCl, pH8.3, 15 mM MgCl2 and 0.01% gelatin), 0.5 µl of dNTPs mix (containing 10 mM of each dNTP), 0.5 µl Taq DNA polymerase (0.05 units/µl). Twenty µl nuclease free water was added to make the volume equal to 25 µl. Best results for the PCR analysis were obtained at conditions mentioned in at 35oC annealing temperature. PCR reactions were performed using GeneAmp PCR system (Applied Biosystem) programmable thermocycler. PCR products obtained were separated on a 1.5% TBE/Agarose gel that was pre-stained with ethidium bromide (1µl for every 10 ml of gel). After the electrophoresis the gel was visualized in UV light. The presence of bands confirmed amplification of the DNA sequence with the primer.
Statistical analysis
The data was analyzed statistically and genetic relatedness or difference was calculated between the cultivars. To evaluate the data each score-able fragment on the gel was considered as a single locus. The presence or absence of band was marked using “1”for presence and “0”for absence. Bi-variate data matrix for all the primers that showed PCR-positive results was constructed. Dendogram was constructed using a computer program “Popgene32” version 1.31 utilizing the data obtained for every primer, to arrange the cultivars into groups of the basis of their genetic differences. UPGMA was also used to calculate the genetic distances between genotypes [17]. The following formula was used to calculate the average genetic difference between different genotypes of cotton.
GDxy = l-dxy/dx+dy-dxy
Where GDxy = Genetic distance between two genotypes,
dxy= Total number of common loci (bands) in two genotypes,
dx= Total number of loci (bands) in genotypes,
dy = Total numbers of loci (bands) in genotypes
Results
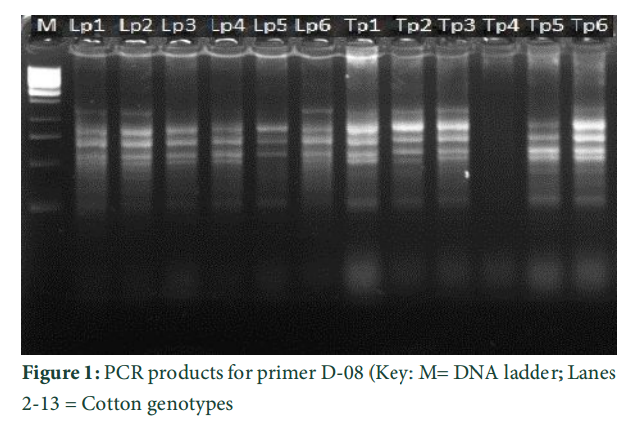
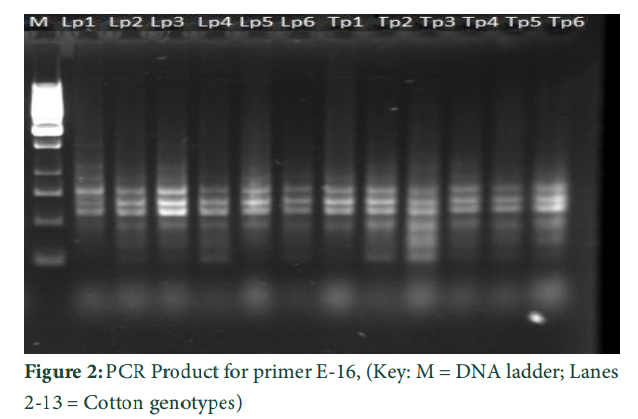
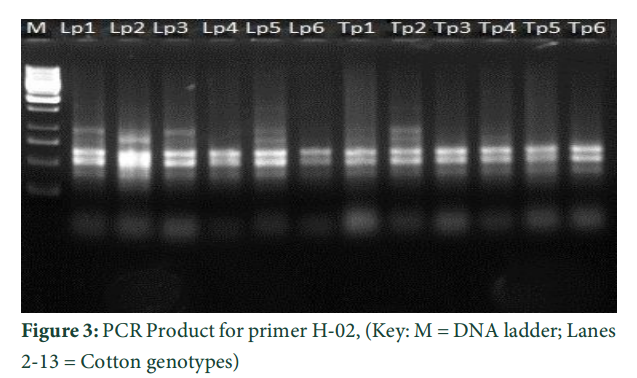
In the present study, twelve genotypes of cotton were evaluated for their genetic diversity using total of 31 RAPD through PCR. Out of 31 primers, only 13 primers (GLA-03, GLC-12, GLD-08, GLD-11, GLE-03, GLE-04, GL-16, GLF-03, GLG-07, GLG-14, GLG-17, GLH-02, and GLH-12) produced reproducible PCR product (Figs. 1-3).
A total of 670 fragments were obtained using these primers, however, polymorphism was detected in 442 alleles (65.97%) while 228 alleles (34.02%) depicted monomorphism. For each individual primer a bivariate data matrix was constructed to estimate the genetic difference between the genotypes. The data indicated that maximum genetic distance (71.8%) was observed between genotypes Lp-1(CIM-11) and Tp-4(Cedix) while lowest genetic distance (33.11) was detected between the genotypes Lp-3(CIM-13) and Tp-1(CIM-132). For other combinations like Lp1x Tp5, Lp5xTp4, Lp5xTp5 and Lp6xTp4 high percentage of average genetic difference was also obtained (Table 4).
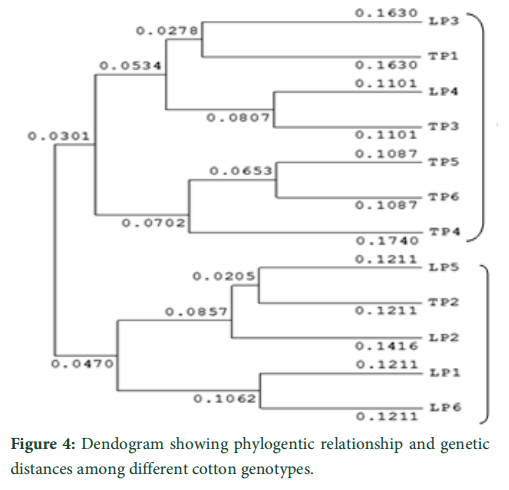
The genetic distances measured by “Popgene” between all the genotypes and the grouping arrangement of all the genotypes of cotton used are shown in Figure 4. Dendogram analysis revealed that the different cotton genotypes were distributed into two main groups (A and B) on the basis of their genetic distances from each other. Among 12 genotypes, 7 genotypes were placed in cluster A and 5 genotypes in cluster B. Both of the major groups were further diverged into four sub-groups and different sub-sub-groups. Group A contain genotypes Lp3, Lp4,Tp1, Tp3, Tp5, Tp6 and Tp4 while group B was composed of Lp1, Lp2, Lp5,Lp6 and Tp2. Group A was again sub grouped into A1 and A2. A1 got four genotypes Lp3, Tp1, Lp4 and Tp3 while A2 got genotypes Tp6, Tp5 and Tp4. The group B was also sub-divided into two sub-groups the B1 and B2. B1 got three genotypes Lp5, Tp2 and Lp2 whereas B2 got Lp1 and Lp6 [19-24].
Tables & Figures
Discussion
PCR markers are extensively used throughout the world for the identification and selection of useful characters and improvement of species. The use of RAPD primers for molecular analysis is especially important as these primers do not require any prior sequence information for analysis and gene mapping. The present research study twelve genotypes of cotton for their genetic diversity using total of 31 RAPD through PCR. Among the tested primers, one third amplified reproducible PCR bands resulting in 670 fragments, 65.97% polymorphism and 34.02% monomorphism. The polymorphic loci revealing difference plays an important role in establishing similarity and therefore relationship among the genotypes [18]. Earlier, Khan et al.[10] reported 70% polymorphism with a maximum of 18 bands produced. For each primer, the selection efficiency was different. The amplification product ranged from 250 to 1250 bp. More or less similar results were also reported in the literature [19] . For each individual primer a bivariate data matrix was constructed to estimate the genetic difference between the genotypes resulting maximum genetic distance of 71.8% between genotypes Lp-1(CIM-11) and Tp-4(Cedix). It was also observed that the data obtained by UPGMA cluster analysis was similar to the results obtained from average genetic distance. Our results strengthened the earlier reports that RAPDs can be used for the estimation of genetic diversity in crop enhancement programs [4-6,10,12,20,21].
A computer software “Popgene” was utilized for the cluster analysis of all the cultivars. Dendogram analysis revealed that the different cotton genotypes were distributed into two main groups (A and B) on the basis of their genetic distances from each other. Among 12 genotypes, 7 genotypes were placed in cluster A and 5 genotypes in cluster B. Both of the major groups were further diverged into four sub-groups and different sub-sub-groups. The cluster analysis showed that there was high similarity among cotton genotypes in their relevant cluster. The possible explanation might be that frequent gene flow from one genotype to another might have occurred. It is possible to breed new cultivars or to create novel germplasm of cotton through hybridization between genetically different species.
The authors declare no conflict of interest.
References
- Hussain A, Ibrahim M, Tajammal MA, Naz MA.Cotton Varieties of Pakistan. Federal Seed Certification and Registration Department. Ministry of Food, Agriculture & Livestock (MINFAL), Government of Pakistan, 2005.
- Abdukarimov AS, Djataev S, Abdukarimov I. Cotton research in Uzbekistan: Elite cultivars and future cotton breeding. Proceedings World Cotton Research Conference Cape Town, South Africa, 2003; Pp. 5-15.
- Ali AM, Ahmed OM, Misaka BC, Latif AH, Elsiddig K, et al. Characterization of cotton germplasm and its utilization in breeding for major production constraints in Sudan. Proceedings World Cotton Research Conference Cape Town, South Africa, 2003; Pp. 16-21.
- Asif M, Rahman MA, Mirza JI, Zafar Y. Parentage confirmation of cotton hybrids using molecular markers. Pakistan Journal of Botany, (2009);41: 695-701
- Bakht J, Fareed A, Shafi M, Swati ZA. Genetic diversity of NURYT-national Uniform Rape Seed Yield Trial and Brassica napus varieties using RAPD markers and biochemical analysis. Pakistan Journal of Botany, (2011a); 43: 2075-2081.
- Bakht J, Ghaffar M, Shafi M, Latif A, Khan S. Determination of genetic diversity of different barley genotypes grown in Khyber Pakhtun Khwa using RAPD markers. Pakistan Journal of Botany, (2011b); 43: 2491-2495.
- Rana MK, Singh VP, Bha KV. Assessment of genetic diversity in upland cotton (Gossypium hirsutum L.) breeding lines by using amplified fragment length polymorphism (AFLP) markers and morphological characteristics. Genetic Resources and Crop Evaluation, (2005); 52: 989-997.
- Lacape JM, Dessauw D, Rajab M, Noyer JL, Hau B. Microsatellite diversity in tetraploid Gossypium germplasm: assembling a highly informative genotyping set of cotton SSRs. Molecular Breeding, (2007); 19: 45-58.
- Mahmood Z, Raheel F, Dasti AA, Shahzadi S, Athar M, et al. Genetic diversity analysis of the species of Gossypium by using RAPD markers. African Journal of Biotechnology, (2009); 8: 3691-3697.
- Khan AI, Awan FS, Sadia B, Rana RM, Khan IA. Genetic diversity studies among colored cotton genotypes by using RAPD markers. Pakistan Journal of Botany, (2010); 42: 71-77.
- Khan AI, Khan IA, Awan FS, Sadaqat HA, Bahadur S. Estimation of genetic distance based on RAPD between 11 cotton accessions varying in heat tolerance. Genetic and Molecular Research, (2011); 10: 96-101.
- Ahmed I, Islam M, Mannan A, Naeem R Mirza B. Optimization of conditions for assessment of genetic diversity in barley (Hordeum vulgare L.) using microsatellite markers. Barley Genetic Newsletter, (2009); 39: 5-12.
- Mattia FD, Grassi F, Imazi S, Labra M. 2008. Chloroplast and nuclear DNA markers to characterize cultivated and spontaneous Ribes. Plant Biosystems, (2008); 142: 204-212.
- Lin Z, He D, Zhang X, Nie Y, Guo X, et al. Linkage map construction and mapping QTL for cotton fibre quality using SRAP, SSR and RAPD. Plant Breeding, (2005); 124: 180-187.
- Weining S, Langrindge P. Identification of napping of pelynorphien in cereals based on polymerase chain reaction. Theatrical and Applied Genetic, (1991); 82:209-216.
- Devos KM, Gale MD. The use of Random Amplified polymorphic DNA markers in wheat. Theoretical and Applied Genetics, (1992); 84: 567-572.
- Ni M, Li WH. Mathematical model for studying genetic variation in terms of restriction endonucleases. Proceedings of the national Academy of Sciences USA, (1979), 76: 5269-5276.
- Hadrys H, Balik M, Schierwater B. Application of Random Amplified Polymorphic DNA (RAPD) in molecular ecology. Molecular Ecology, (1992); 1: 55-60.
- Mumtaz AS, Naveed M, Shinwari ZK. Assessment of genetic diversity and germination pattern in selected cotton genotypes of Pakistan. Pakistan Journal of Botany, (2010); 42: 3949-3956.
- Ali MA, Seyal MT, Awan SI, Niaz S, Ali S, et al. Hybrid authentication in upland cotton through RAPD analysis. Australian Journal of Crop Sciences, (2008); 2: 141-149.
- Bakht J,Nazma N, Shafi M. Genetic diversity of different peaches cultivars and genotypes through RAPD primers. Pakistan Journal of Botany, (2012); 44: 1527-1532.
This work is licensed under a Creative Commons Attribution-Non Commercial 4.0 International License. To read the copy of this license please visit: https://creativecommons.org/licenses/by-nc/4.0/