

Full Length Research Article
Genome-Wide Identification of Natural Selection Footprints in Bos Indicus Using Principal Component Analysis
Hamid Mustafa1, Waqas Ahmad Khan2*, Tad Sonstegard3, Yi Li4, Noor Ul Ain5, Adeela Ajmal1
Adv. life sci., vol. 5, no. 2, pp. 67-72, February 2018
*– Corresponding Author: Waqas Ahmad Khan (Email: waqaskhang@gmail.com)
Authors' Affiliations
2- Department of Biotechnology, Faculty of Science, University of Sargodha, Sargodha, Pakistan
3- Bovine Functional Genomics Laboratory (BFGL), USDA, Beltsville, MD 27030, USA
4- School of Statistics, Shanxi University of Finance and Economics, Taiyuan, Shanxi, 030006 China
5- The University of Agriculture, Peshawar-Pakistan
Abstract![]()
Introduction
Methods
Results
Discussion
References
Abstract
Background: To describe natural selection, numerous analytical methods for ascertaining candidate genomic region have been developed. There is a substantial drive in population genomics to identify loci intricate in local adaptation. A potent method to find genomic regions subject to local adaptation is to genotype numerous molecular markers and look for outlier loci.
Methods: In this study, population structure and genome wide footprints scan of natural selection in cattle was performed using principal component analysis based on alternative individual method assumed in the PCAdapt R-package. This method was used on the hypothesis that extremely related population markers are also local population adaptation candidates. To test PCAdapt method in cattle, the data of sixty three animals were collected from four different origins or agro-ecological zones (Achai = 18, Cholistani = 13, Lohani = 19, and Tharparkar = 13) and genotyped using the high density SNPs BeadChip.
Results: As expected from the sampling from different zones the principal component result indicated the clear division in these animals into three clusters. K=3 was the optimal number suggested by eigenvalues.
Conclusion: The result of this study revealed that the genomic regions harboring signals of the candidate genes were associated with immunity system and muscle formation. Signature of selection detecting in this study targeted the historical adaptation in these breeds that will be useful in future to understand cattle origin under different environment.
Key words: adaptation, cattle, selection, high density, PCAdapt
Introduction
Advancement of genotyping and sequencing technologies will make feasible to answer many biological questions in conservation genetics that have been obstinate until now. Evolutionary processes either for natural or modern genetic selection, both results in phenotypic changes [1]. Cattle genome represents an important biological source for ascertaining genetic variation that shapes the evaluation of phenotypic diversity. The challenge to whole genome analysis is the identification of nucleotide variation patterns that can be described by selection pressure vs. random drift [2]. Features of selection signatures in cattle depend on time and strength of selection events. The process of natural selection provides the opportunity to any organisms for best survival in their environment, and gives maximum chance to contribute the genetic variation to their coming future generations. Natural selection may acts in three ways: positive natural selection, purifying natural selection and balancing natural selection [3]. Positive natural selection is the main dynamic force behind the individuals’ adaptation to their climate. In order to offer a slant of variants those are hypothetically involved in natural selection, genome scans measure the genetic differentiation between populations considering that extreme values correspond to candidate regions [4]. However, differentiation level can have numerous causes; individuals’ adaptation to their native climate is a protruding reason of differentiation patterns for loci adaptive exceeding neutral expectations [5].
Various statistical methods have been established to detect candidate regions in the genome that have been the targets of natural selection. The extreme value of the Fst index is a recurrent method in population genetics to measure genetic variation between populations [6]. The Wright`s FST is identified in a population for selectively neutral loci by genetic drift, which affects SNPs across the genome. Natural selection has locus specific effects in contrast to selectively neutral loci and causes departure in FST values at certain linked loci [7]. Although, FST related methods have some limitation due to individual`s grouping into populations that can be subjective sometimes and cause loss of vital selection signatures [5]. FST based methods to scan genome can yield some false positives of signature selections because of statistical and biological errors [8]. In genetically homogenous population, where a subpopulation is difficult to define or there is admixture between individuals, the FST index computation becomes difficult and challenging [9]. The alternative method based on the principal component analysis (PCA) is proposed by Duforet-Frebourg et al. [5] to identify candidate markers for natural selection that identify population structure using multivariate appraisal. The obtained principal coordinates and correlation between genetic variants provide a theoretical outline to detect local adaptive variants without any priory population structure information [4]. The implementation of PCA in PCAdapt R package has three leading benefits compared to classical Wright`s FST method: 1) fit on the individual basis, 2) reduced computation time and 3) different evolutionarily related candidate loci [10]. Therefore, the objective of present study was to scan genome wide population structure and to detect candidate regions that have been targets of natural selection using PCA implemented in PCAdapt R package.
Methods
Data Set
To identify natural selection footprints in Bos indicus, the genotype data set from 53 individuals belonging from four different breeds and agro-ecological zones, including Achai, Cholistani, Lohani, and Tharparkar were analyzed. The DNA was extracted by using the modified organic protocol at animal genetics laboratory UVAS, Lahore. The quality of extracted genomic DNA was checked both qualitatively and quantitatively. Selected animals samples were genotyped on the Illumina Bovine High Density Bead Chip assay (which features 777, 962 SNP probes) at the BFGL, ARS/USDA, Beltsville, MD, USA, using Illumina, Inc. San Diego, CA 92122, USA, standard procedures (http://www.illumina.com). The iScan generated genotype data set were further processed using Illumina Genome Studio software (Version 1.9.0). The Pedigree file (.pad) and SNP file (.map) were generated for downstream analysis using PLINK ver. 1.9 [11]. Quality control was performed across all selected four breeds for further analysis. SNPs were removed from the data set with have call rate of less than 95 %, minor allele frequency lower than 0.05.
Natural selection footprints analysis
The whole genome scan for natural selection footprints was performed on alternatively adopted method, PCAdapt R package as described by Luu et al. [10]. The identification of outliers, the associated SNPs with selection, is based on the z-scores vector attained when SNPs regressing with the K principal components. The Mahalanobis distance, a multivariate procedure that measure distance of point “P” from the mean, is test statistics. Representing by the K vector Z scores between the j-th SNP and the first K PCs, the Mahalanobis distance squared as defined by Duforet-Frebourg et al. [4]:
![]()
Where, Σ and Z are the Z score estimates of mean and covariance matrix of Z scores, respectively.
The Mahalanobis distance must be converted into the p-values to achieve the multiple hypotheses testing. To decide the threshold of p-values Luu et al. [10] recommend to use false discovery rate (FDR) method that run a list of candidate markers with as expected proportion of false discoveries lower than specified value. The FDR controlling is based on the q value procedure which is assumed in the q value R environment [12] that convert the p values into the q values and permit the control of identified value α of FDR) and exposure of candidate markers with q values lower than identified α value [4,10].
Results
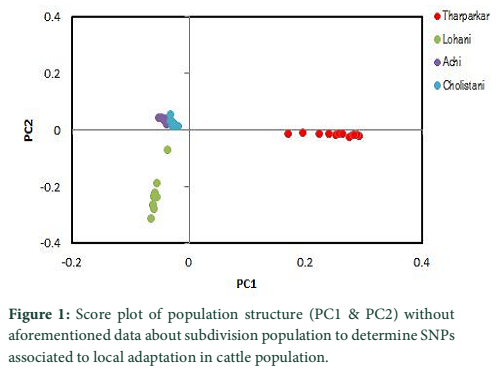
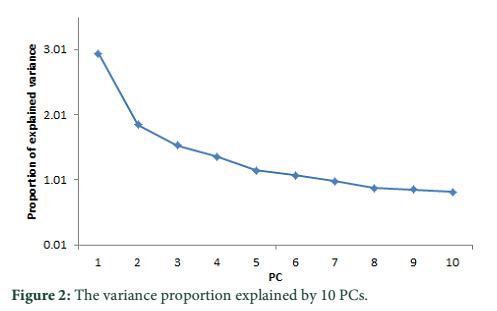
A substitute method based on PCA analysis has been used to define the population structure without aforementioned data about subdivision population and to perform genome scan to determine SNPs associated to local adaptation in cattle population. As projected based on population’s origin the first and second principal components separated the population structure to the three genetic clusters (Figure 1). The Achi and Cholistani populations have been accompanying into the one group mostly due to the high genetic similarity between them that can be ascribed to the common ancestors. The eigenvalue`s decaying established to use of K = 3 as best because the eigenvalues decreased between K = 3 and K = 5. Figure 2 illustrates in declining order the percentage of variance elucidated by each PCs.
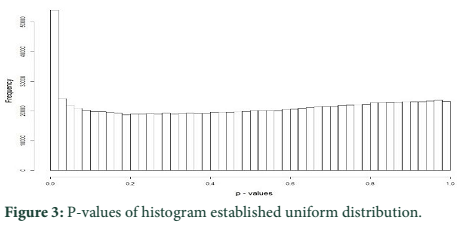
P-values of histogram established that most of them followed the uniform distribution. Figure 3 presents that the p-values were well adjusted since there was an assortment of identical sharing and of a high dissemination around 0, which corresponded to outlier loci.
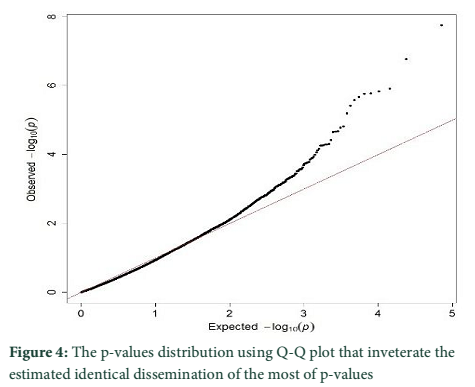
The p-values distribution was also tested by using Q-Q plot that inveterate the estimated identical dissemination of the most of p-values (figure 4). The outlier loci presences represent the lowest p-values that were reduced than expectations.
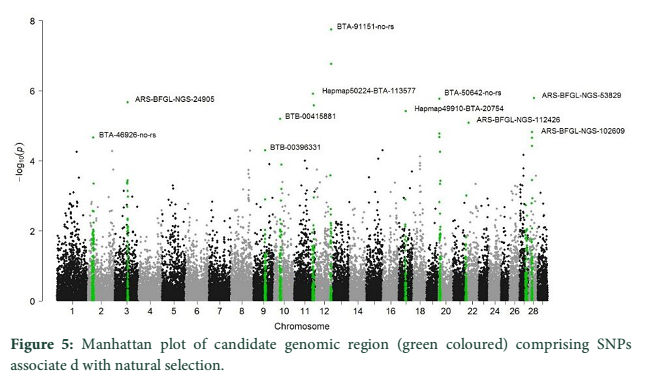
Manhattan plot (Figure 5) showing the main SNPs outlier that have been identified using the genomic scan for natural selection`s footprints. PCAdapt implementation package was used to determine 11 outliers based on FDR (equal to 10 %) and some of these were adjacent to the genomic regions. The candidate genes like IL21, IL2, GHR, CAPN2, and CAPN3 were adjacent to these outlier's loci that associated significantly with immune system, muscle growth and some economically important traits in cattle.
Tables & Figures
Discussion
PCA based on alternative method has been used to identify the population structure without any priory breed information and perform genome wide scan to detect association of certain SNPs to local climate adaptation in cattle breeds [2,5]. The first and the second principal component separated the population, from different origins, into three genetic clusters (Figure 1). The Achi and Cholistani population have been interrelated into one cluster because of high genetic resemblance between them that can be ascribed to the common ancestors. The decay of eigenvalues from K=3 to K= 5 confirmed that K=3 can be used as the optimal value (Figure 2). Figure 3 indicates that p values establish a uniform distribution among most of the breeds. The calibrated p values were linked to outer loci
since there was a combination of uniform distribution around 0 [2,10,12]. The Q-Q plot established the p values distribution as uniform distribution was expected for most of the p values (Figure 4). The presence of outlier loci showed lowest p value which was reduced from expectations. The outlier SNPs are depicted in a Manhattan plot which has been identified using whole genome scan for natural selection footprints (Figure 5). PCAdapt implementation package was used to determine 11 outliers based on FDR (equal to 10 %) and some of these were adjacent to the genomic regions. The candidate genes like IL21, IL2, GHR, CAPN2, and CAPN3 were adjacent to these outlier’s loci that associated significantly with immune system, muscle growth and some economically important traits in cattle [13-15].
Previously reported results of many studies in cattle species affords the best opportunity to identify how selection has influenced the variation and architecture of the genome. Selection gnarled genetic variation level that occurred in the domesticated population. Livestock breeds selection at the same time has inclined to specific fix variants which have become unique genetic signatures of that breed compared with others [16]. The strong selective footprints present across the bovine genome were studied in different populations using numerous methods based on frequency spectrum, population differentiation (FST) and extent of linkage disequilibrium [13,17,18]. The selective sweeps numbers were identified across different cattle breeds and Stella et al. [19] reported 215 regions of selective sweeps in five different dairy breeds. Druet et al. reported 147 regions for 12 different breeds [18]. Flori et al. [20] investigated selective footprints in French dairy cattle breeds and detected a much lower proportion of selection footprints (16 regions) [20] and Mancini et al. for Italian cattle breed [13]. Although, the relative low candidate loci numbers in this study was found in different breeds using the alternative method proposed by Duforet-Frebourg et al. suggests that alternative method based PCA can be effective for the selection sweeps identification in cattle [4]. The whole genome natural selection footprints scan across Achi, Cholistani, Lohani and Tharparkar populations showed 11 outlier loci which were strongly correlated to the observed population structure (false discoveries rate =10%). Detecting signature selections in genomic regions covering genes involved in muscle growth, immune system and body growth suggested a link to natural selection during breed evolution. The breeds used in this study belong to different agro-ecological areas (low lands and plans) and muscle development, body growth, and immune system traits are the closest in agreement with the overall body description of those breeds. The result of this study is also valuable for the cattle farmers of these regions due to their environmental resistance, survivability, and longevity. The results specified that those areas are not only significant artificially but also naturally to adapt and survive the local environment.
Acknowledgements
The authors would like to acknowledge the financial support of Higher Education Commission of Pakistan and BFGL, USDA, USA for laboratory facilities.
The authors declare that there is no conflict of interest regarding the publication of this paper.
References
- O’Neill CJ, Swain DL, Kadarmideen HN. Evolutionary process of Bos taurus cattle in favourable versus unfavourable environments and its implications for genetic selection. Evolutionary Applications, (2010); 3(5‐6): 422-433.
- Moravčíková N, Kukučková V, Mészáros G, Sölkner J, Kadlečík O, et al. Assessing footprints of natural selection through PCA analysis in cattle. Acta Fytotechnica et Zootechnica, (2017); 20(2); 23-27.
- Martins H, Caye K, Luu K, Blum MG, Francois O. Identifying outlier loci in admixed and in continuous populations using ancestral population differentiation statistics. Molecular ecology, (2016); 25(20): 5029-5042.
- Duforet-Frebourg N, Bazin E, Blum MG. Genome scans for detecting footprints of local adaptation using a Bayesian factor model. Molecular biology and evolution, (2014); 31(9): 2483-2495.
- Duforet-Frebourg N, Luu K, Laval G, Bazin E, Blum MG. Detecting genomic signatures of natural selection with principal component analysis: application to the 1000 Genomes data. Molecular biology and evolution, (2015); 33(4): 1082-1093.
- Nielsen R. Molecular signatures of natural selection. Annu Rev Genet, (2005); 39: 197-218.
- Akey JM, Zhang G, Zhang K, Jin L, Shriver MD. Interrogating a high-density SNP map for signatures of natural selection. Genome research, (2002); 12(12): 1805-1814.
- Bierne N, Roze D, Welch JJ. Pervasive selection or is it…? why are FST outliers sometimes so frequent? Molecular ecology, (2013); 22(8): 2061-2064.
- Waples RS, Gaggiotti O. INVITED REVIEW: What is a population? An empirical evaluation of some genetic methods for identifying the number of gene pools and their degree of connectivity. Molecular ecology, (2006); 15(6): 1419-1439.
- Luu K, Bazin E, Blum MG. pcadapt: an R package to perform genome scans for selection based on principal component analysis. Molecular ecology resources, (2017); 17(1): 67-77.
- Purcell S, Neale B, Todd-Brown K, Thomas L, Ferreira MA, et al. PLINK: a tool set for whole-genome association and population-based linkage analyses. The American Journal of Human Genetics, (2007); 81(3): 559-575.
- Storey JD. A direct approach to false discovery rates. Journal of the Royal Statistical Society: Series B (Statistical Methodology), (2002); 64(3): 479-498.
- McClure M, Ramey H, Rolf M, McKay S, Decker J, et al. Genome‐wide association analysis for quantitative trait loci influencing Warner–Bratzler shear force in five taurine cattle breeds. Animal genetics, (2012); 43(6): 662-673.
- Giusti J, Castan E, Dal Pai M, Arrigoni MDB, Baldin SR, et al. Expression of genes related to quality of Longissimus dorsi muscle meat in Nellore (Bos indicus) and Canchim (5/8 Bos taurus× 3/8 Bos indicus) cattle. Meat Science, (2013); 94(2): 247-252.
- Gowane G, Sharma A, Sankar M, Narayanan K, Bisht P, et al. The expression of IL6 and 21 in crossbred calves upregulated by inactivated trivalent FMD vaccine. Animal biotechnology, (2014); 25(2): 108-118.
- Gutiérrez-Gil B, Arranz JJ, Wiener P. An interpretive review of selective sweep studies in Bos taurus cattle populations: identification of unique and shared selection signals across breeds. Frontiers in genetics, (2015); 6167.
- Qanbari S, Gianola D, Hayes B, Schenkel F, Miller S, et al. Application of site and haplotype-frequency based approaches for detecting selection signatures in cattle. BMC genomics, (2011); 12(1): 318.
- Druet T, Pérez‐Pardal L, Charlier C, Gautier M. Identification of large selective sweeps associated with major genes in cattle. Animal genetics, (2013); 44(6): 758-762.
- Stella A, Ajmone-Marsan P, Lazzari B, Boettcher P. Identification of selection signatures in cattle breeds selected for dairy production. Genetics, (2010); 185(4): 1451-1461.
- Flori L, Fritz S, Jaffrézic F, Boussaha M, Gut I, et al. The genome response to artificial selection: a case study in dairy cattle. PloS one, (2009); 4(8): e6595.
This work is licensed under a Creative Commons Attribution-Non Commercial 4.0 International License. To read the copy of this license please visit: https://creativecommons.org/licenses/by-nc/4.0