
Full Length Research Article
Molecular Characterization of EGLN1 Gene in Fast and Slow Moving Animals of Diverse Terrain
Rashid Saif1*, Naila Naz2, Beenish Tariq2, Ali Iftekhar1
Adv. life sci., vol. 5, no. 4, pp. 171-178, August 2018
*- Corresponding Author: Rashid Saif (Email: rashid.saif37@gmail.com)
Authors' Affiliations
2- Department of Biotechnology, Kinnaird College for Women, Lahore, Pakistan
Abstract![]()
Introduction
Methods
Results
Discussion
References
Abstract
Background: Process of animal migration from their habitat to a new environment is always problematic due to low adaptive tendency, which ultimately affect their production, behavior and overall performance. Current study is focused to explore the sequence diversity of EGLN1 gene in relation to animal acclimatization at higher altitude under deprived oxygen or ability of better utilization of oxygen which is considered to be liable for their agility in diverse terrains. Fast and slow moving animals of plain and hilly terrains are potential species to study this phenomenon.
Methods: Molecular characterization of EGLN1 gene was performed in sheep, goat, buffalo and camels of Pakistan as slow moving candidate species, while tiger, leopard, wolf, ibex, urial and markhor as fast moving candidate species of diverse terrains by extraction their DNA from whole blood, followed by PCR amplification and sequence analysis of EGLN1 gene through BioEdit software. Later on, certain bioinformatics tools like MEGA, protparam and blast2sequence are used for the characterization of the normal and mutant EGLN1 protein.
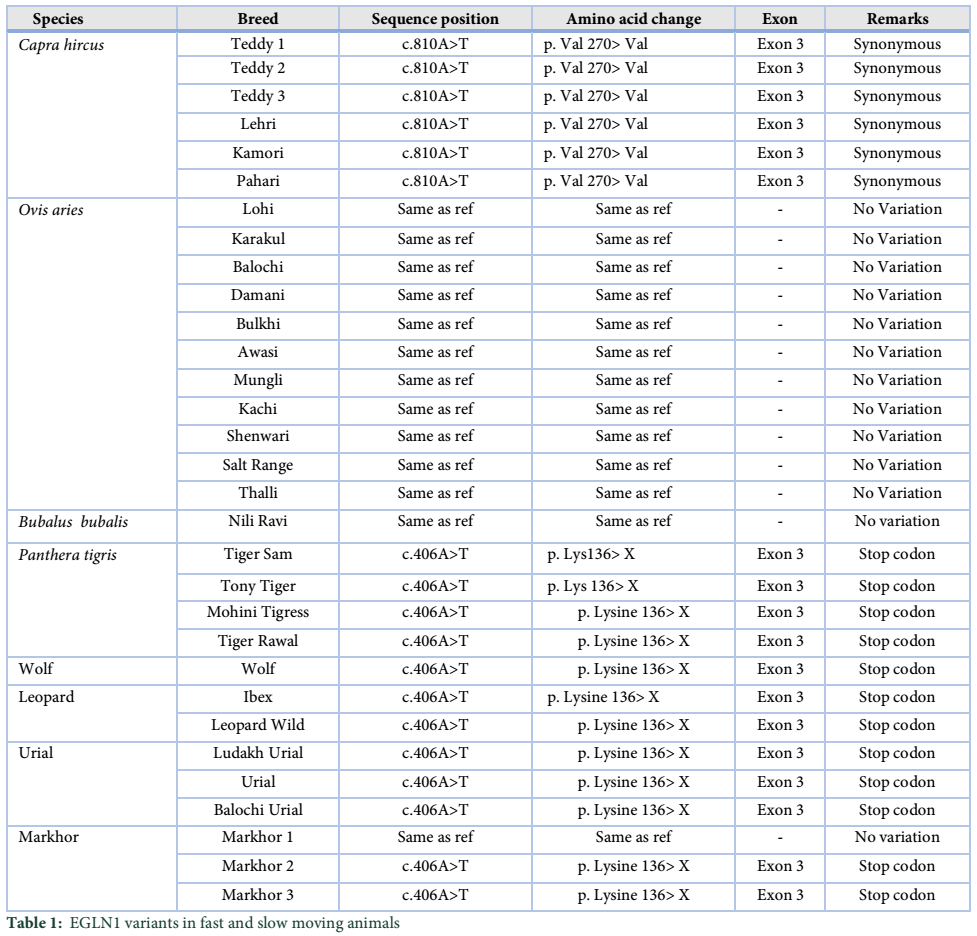
Results: Current study revealed that goat and camel showed a nucleotide change at c.810 position. While all fast moving animals of higher altitude showed a nucleotide change at position c.406 except one sample of markhor.
Conclusion: Current study will assist to have an idea of sequence diversity of aforementioned candidate gene responsible for adaption of animals in oxygen deprived environment of diverse terrain and may be responsible for their agile behaviour of movement.
Keywords: EGLN1, Fast moving animals, Slow moving animals, Animal acclimatization, Behavioural traits, Pakistani animals
Introduction![]()
The process of understanding oxygen utilization has been intriguing to the evolutionary biologists since a long time because animal of diverse terrains behave differently due to ectopic levels of atmospheric oxygen of their habitat. Oxidation, being an important process for energy generation, is imperative for living organisms. Any interruption in the process may result in complete shutting down of physiological processes [1]. Fast moving animals living at high altitudes have the tendency to obtain low levels of oxygen but still keep a fast pace to survive. On the contrary, slow movers living in the low-lying areas are adapted to obtain excessive amounts of oxygen. However, experiencing low levels of oxygen than normal, a condition known as Hypoxia, is a serious issue in animals when moving to a very different habitat [2]. Animals have, therefore, developed a complex mechanism of hypoxia-tolerance to tackle this issue. EGLN1 (Egl-9 Family Hypoxia-Inducible Factor 1) gene is a candidate gene involved in helping living organisms in combating hypoxia and therefore making it easy for them to move about from one geographical region to another [3,4]. This gene serves as the best candidate gene involved in the process of oxygen sensing and hypoxia tolerance. Absence of this gene results in altered oxygen utilisation pathways and thus any change, deletion or any mutational event in this gene or any of its loci may lead to changes in an organism’s hypoxia tolerance levels [5,6]. The purpose of this study is to compare EGLN1 gene of high and low altitude animals for fast and slow locomotive abilities using various mutational and protein analysis tools [7]. For the study of EGLN1 gene in fast and slow moving animals DNA samples from fast movers living at high altitudes (tiger, leopard, wolf, markhor, ibex, urial) [8] and slow movers living in low lying areas (sheep, goat, buffalo) [9,10] are obtained and analysed for similarities and differences in their gene sequences which may have helped them to adapt differently in their respective natural habitats. Hypoxia-inducible factor prolylhydroxylase 2 (HIF-PH2), or prolyl hydroxylase domain-containing protein 2 (PHD2). It is an enzyme encoded by the EGLN1 gene. It is also known as Egl nine homolog 1. PHD2, a α-ketoglutarate/2-oxoglutaratedependent hydroxylase, belongs to a superfamily nonhaem iron-containing proteins. In humans, PHD2 is one of the three isoforms of hypoxia-inducible factorproline dioxygenase, which is also known as HIF prolylhydroxylase. HIF-1α is a ubiquitous, constitutively synthesized transcription factor responsible for upregulating the expression of genes involved in the cellular response to hypoxia. These gene products may include proteins such as glycolytic enzymes and angiogenic growth factors. In normoxia, HIF alpha subunits are marked for the ubiquitinproteasome degradation pathway through hydroxylation of proline-564 and proline-402 by PHD2. Prolyl hydroxylation is critical for promoting pVHL binding to HIF, which targets HIF for polyubiquitylation.
Methods![]()
Sample collection and DNA extraction
Samples of fast moving animals living at high altitudes includes tigers (Rawal, Sam, Mohini, Tony), Wolf, Ibex, Wild Leopard, Urial and Markhor),and slow moving animals living in low lying areas includes sheep (Mungli, Lohi, Karakul, Balochi, Damini, Bulkhi, Awasi, Kachi, Shenwari, Salt Range, Thalli), Nili Ravi Buffalo, and goats(Pahari , Lehri , Kamori and Teddy) had been collected. DNA had been extracted using organic phenol-chloroform extraction method.
Primer designing
Accession number XM_015104286 from NCBI GenBank, helped determine that EGLN-1 gene contained a Prolyl Hydroxylase Domain protein 2 (PHD2) in the exon 3. Sequence of this exon was placed on Primer3 online tool which generated forward and reverse primers for the amplification of exon 3. A total amplification product of 373 bp was predicted by this tool.
PCR optimization, DNA amplification & sequencing
Once optimization of the primers made from Ovis aries was done, specific PCR at 58°C was used for amplification of both fast moving and slow moving animals. Following amplification, PCR products were immediately cleaned using EXOSAP (Exonuclease shrimp alkaline phosphatase) [11,12] which was then followed by sequencing using Sanger Sequencing method.
Bioinformatics tools
Sequence and mutational analyses were carried out by aligning all the sequenced PCR products using online bioinformatics tool – blast2sequence (www.ncbi.nlm.nih.gov). For further study of the mutational events, BioEdit software was used [13]. For checking ancestral linkages between the species, phylogenetic analysis was performed using MEGA (Molecular evolutionary Genetics Analysis) software. Furthermore, for the comparison of physiochemical properties (molecular weight, isoelectric point, extinction coefficient, etc.) of the normal and mutated proteins, protparam (http://web.expasy.org/protparam/) tool was applied. In-silico protein analysis studies was carried out to determine the role and biological function of protein. Conserved domains were observed through Motif Scan (http://myhits.isb-sib.ch/cgi-bin/motif_scan) in which results were compared with other available databases.
Results![]()
Mutational analysis
Once the sequences were aligned using blast2sequence online tool, the resulting trimmed DNA sequences were then analyzed and compared with the reference sequence, that is, Ovis aries. Ovis aries was selected as reference for comparison because it is very closely related to sequenced species. The CDS (coding DNA sequence) of the reference sheep sequence was compared and checked for any polymorphisms with the candidate (query) species. All the sheep samples showed 100% identity when aligned with the reference sheep sequence and no polymorphisms were detected. Similarly, Nili Ravi buffalo DNA sequence also showed 100% identity with the reference sequence. On the contrary, a single nucleotide change was observed in all the goat samples no. 1, 2, 3 and 4 of Teddy, Kamori, Pahari and Lehri Goat. This haplotype 1 (H1) consisted of a single nucleotide change at position c.810 where an adenine was replaced by a thymine (A>T) in all the goat samples.
After the analysis of slow moving species, DNA sequences of the fast-moving animals were analyzed and compared with the reference sequence, Panthera tigris. Exon 3 of the reference sample was compared with the DNA sequences of all the fast-moving animals, living at high altitudes. Another haplotype, (H2), was observed in all the DNA sequences of the fast-moving animals, viz. Sam, Tony and Rawal Tiger, Mohini Tigress, Wild Leopard, Wolf, Ibex, Urial, Balochi Urial and two samples of Markhor. This haplotype is associated with fast moving animals. A single nucleotide polymorphic change at position c.406 was found in all the samples where an Adenine was replaced by a Thymine (A>T). However, no change was observed in Markhor 1 as it showed 100% identity to the reference sample (Table1).
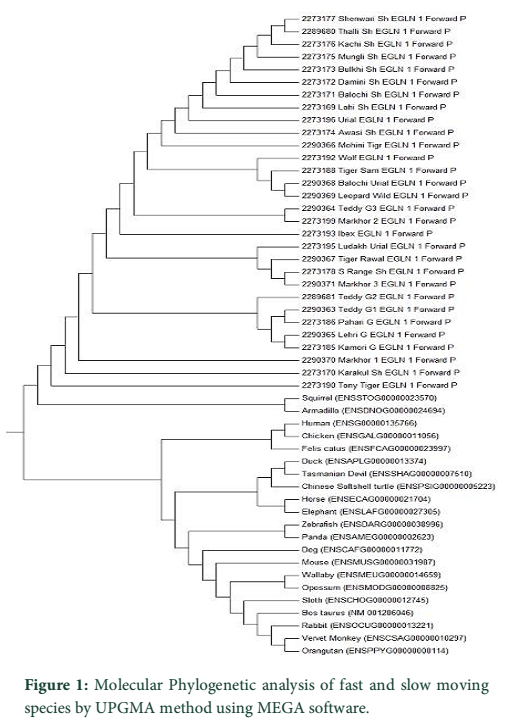
Phylogenetic analysis within fast and slow moving animal species
For analyzing ancestral relationships between the animals under study, phylogenetic trees were constructed using Molecular evolutionary and phylogenetic analysis software (MEGA). Phylogenetic analysis was carried out to study the relationship among the species. The analysis involved 18 nucleotide sequences from the slow-moving animals living in low lying areas of Pakistan, 13 nucleotide sequences of fast movers and 20 different breeds that were closely related to the species under test (Bos taurus, Felis catus, Human, Mouse, Chicken, Duck, Horse, Dog, Rabbit, Zebrafish, Wallaby, Vervet monkey, Tasmanian devil, Sloth, Orangutan, Opossum, Panda, Squirrel, Elephant, Chinese soft shell turtle and Armadillo).
The phylogenetic analysis was carried out using MEGA7. The figure shows whole variance of mutational events for both fast and slow moving animals that are understudy. The tree represents close relationship between all the sheep species as they all arose from a common node and thus represents no significant mutational events. On the contrary, goat species show more mutational frequency than sheep. Figure 1 shows all the candidate species, that is, all the hypoxia susceptible and hypoxia tolerant species which were compared by constructing a cladogram in MEGA7 using UPGMA method (Fig. 1).
Application of bioinformatics tools
ProtParam tool
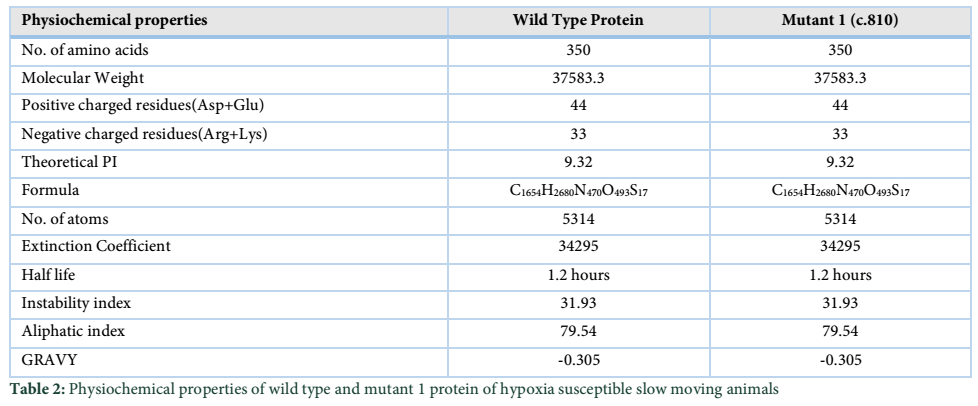
ProtParam is an online bioinformatics tool which is used for determining the physiochemical properties of proteins. These properties help in comparing and contrasting the normal protein with the mutant protein and thus help to determine whether the change in nucleotide has drastically affected the functioning of the protein or not (Table 2).
Wild type EGLN1 protein and the Mutant 1 protein have same values for all the physiochemical properties which is due to the fact that the nucleotide change at position c.810 does not change the protein and its function.
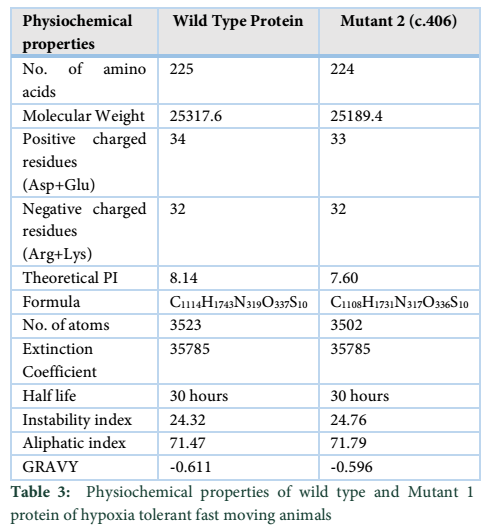
Thereby, this comparison helped in determining the fact that a nucleotide change in all the goat species did not alter the function of the EGLN1 gene and thus no change of properties occurred (Table 3).
Wild type EGLN1 protein has 225 amino acids whereas Mutant 1 protein showed decrease in the number of amino acids to 224. Despite this, Mutant 1 has more molecular weight than the wild type protein. Instability index value changed for the Mutant 1 protein but both values were less than 40 which indicated that both are highly stable proteins. Theoretical pI (isoelectric point) of both proteins differed remarkably as wild type protein showed a pI value of 8.14 while for Mutant 1 it was 7.60.
Motif scan tool
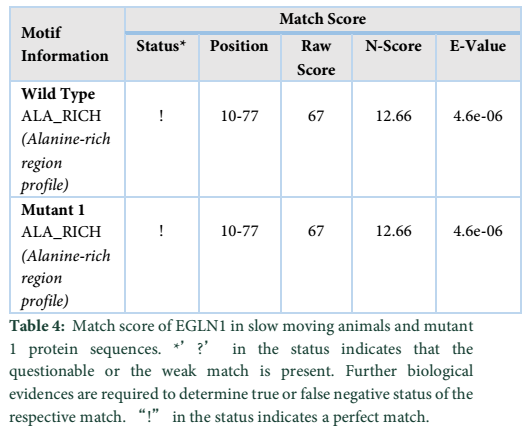
This is an online bioinformatics tool which aids in determining the presence of different motifs present in a particular protein sequence. The tool is useful for alignment and matching scores between the sequences which helps in analyzing the altered motif properties resulting in the formation of an altered protein (Table 4).
The motif information obtained for the slow-moving animals indicates the presence of and ALA_RICH (Alanine-rich region profile) domain present in both the proteins. As the nucleotide change at position c.810 showed no change in the protein formation, thereby, both the motifs showed perfect match and all the values for the motifs were found to be identical (Table 5).
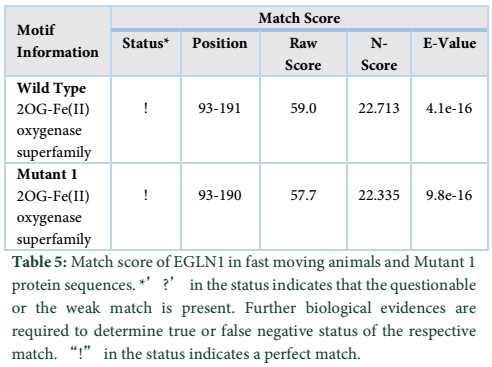
The results obtained show the presence of a 2OG-Fe(II) oxygenase superfamily domain in the wild type protein while the Mutant 1 protein showed a perfect match with the mutant protein indicated by “!” in the status. The domain exists between 93-191 amino acids in both the proteins. However, the E-value and Raw score changed due to the nucleotide change at position c.406.
Tables & Figures
Discussion![]()
Various genetic differences found in EGLN1 gene in the inhabitants of low and high-altitude areas have been associated with hypoxia-tolerance and thus, high-altitude adaptation. Due to this reason, EGLN1 gene serves as the best candidate gene involved in hypoxia-tolerance. Single Nucleotide Polymorphisms (SNPs) detected in EGLN1 gene are thereby, held responsible for high-altitude adaptation [1,3,5,12,13]. In this study, a total 31 animal species were studied. Out of 31 samples, 18 sheep and goat breeds were selected to serve as candidate animals for the domestic inhabitants, while 13 samples of wild animals were identified to serve as candidate animals living in the high-altitude areas. In order to check for the presence of SNPs in EGLN1 gene, primers were designed from the exon 3 of sheep and all samples were run on PCR which amplified them. These amplified products were then sequenced and analysed for different mutations using BioEdit and BLAST2 sequence (http://blast.ncbi.nlm.nih.gov), followed by phylogenetic analysis through MEGA (Molecular and Evolutionary Genetics Analysis).
Sequence alignment tool and Blast2sequence were used for alignment of the DNA sequences obtained after sequencing of the PCR products. Coding DNA sequence for EGLN1 protein was taken from both fast and slow moving animals in order to locate polymorphisms that might have taken place in the samples. Sequence diversity analysis of the domestic species shows that all the sheep breeds are identical to the reference sheep sequence (ENSOARG00000003271). A similar study was conducted in different sheep breeds inhabiting high and low altitude areas which showed A135G and C193T SNPs in intron 4 (1). Similarly, when goat breeds were aligned with the reference goat sequence (XM_005698973), the alignment showed an SNP at the same locus (c.810A>T) in all the goat breeds viz. Teddy, Kamori, Pahari and Lehri Goat. Protein translation was performed and the reference protein was aligned with all the six goat breeds. It is observed that this change in nucleotide results in the formation of same amino acid, that is, the codon GUA is changed to GUU. Further, this study showed that both protein codes code for amino acid valine and thus, the change is synonymous.
Phylogenetic tree is constructed on the basis of EGLN1 gene sequence in 18 slow moving species of low lying areas and for comparison, 10 samples from ENSEMBL database (http://asia.ensembl.org/index.html) are obtained. (Figure 1) shows that it is an unrooted tree generated with the help of MEGA7. The evolutionary history is inferred using the UPGMA method [14] UPGMA (Unweighted Pair Group Method with Arithmetic Mean) is a simple agglomerative (bottom-up) hierarchical clustering method. The cladogram shows two clades emerging from a common ancestor. First clade consisted of goat and sheep breeds while the second clade has rest of the domestic species. Former clade shows that sheep and goat are closely related species. Kamori and Pahari goat, Thalli sheep and Nili Ravi buffalo are nearest to each other exhibiting close proximity of their evolutionary histories. The latter clade shows close relation between chicken and duck, Felis catus and human. This tree has been constructed on the basis of one gene only, EGLN1. Whole genome approach has not been used therefore, these results might not be the standard ones.
Protparam tool (http://web.expasy.org/protparam/) is applied for analyzing the physiochemical properties of wild type and altered protein formed due to the SNPs found in this study. This analysis is performed in slow moving animals of low-lying areas. The number of amino acids in both the proteins are identical, that is, 350 AA. Both wild type and Mutant 1 protein have similar molecular weights, identical values of positive and negative charged residues and similar extinction coefficients, explaining that how much amount of light is absorbed by a certain protein. Both the proteins, i.e. the Wild type and Mutant 1, shows similar values for half-life (time when the protein is degraded into half after its synthesis) and both proteins have instability index less than 40, indicating that both are highly stable proteins [15]. The “Aliphatic Index” indicates the volume occupied by the aliphatic side chains. The aliphatic index for wild type and Mutant-1 are also similar, i.e. 31.93. “GRAVY” indicates the hydrophobicity of the protein; more positive score specifies more hydrophobicity, results shows negative values [16]. Motif scan tool was also applied on slow and fast moving species of different altitude regions for analyzing the motif information within wild type and mutants of EGLN1 protein. Results show that ALA_RICH (Alanine-rich region profile) was present in wild type protein of slow moving species whereas a similar domain was found in the Mutant 1 protein. (Table 4) displays the status as “!” which means that a strong match is found. This indicates that it is highly unlikely for this result to be false positive.Sequence analysis helped in determining distinctive differences in the sequences of all the animals under study. SNPs are also detected in wild animals' cross species. The sequence analysis shows great diversity between the sequences of wild animals indicating that natural selection is a major contributor towards adaptive process [17].
Mutational analysis of the wild species with reference tiger sequence (XM_007086052) showed an SNP at a similar locus (c.406A>T) in all the wild species. However, sequence alignment of Markhor 1 with Panthera tigris shows that both sequences are identical and thus no change is observed. Protein alignment by Blast-p showed the formation of stop codon at p.136 due to the change in nucleotide. On the conflicting, Protein alignment of Markhor 1 with reference tiger protein showed no change in the protein sequence, confirming that no protein change exists.
Phylogenetic tree is constructed on the basis of EGLN1 gene sequence in 13 fast moving species of high altitude areas and for comparison, 10 samples from ENSEMBL database (http://asia.ensembl.org/index.html) are obtained. (Figure 1) shows that it is an unrooted tree generated with the help of MEGA7. The evolutionary history is inferred using the UPGMA method [18]. The cladogram shows two clades emerging from a common ancestor. Balochi Urial and Leopard wild, Ibex and Urial, Wolf and Markhor 3, Tasmanian Devil and Chinese Soft Shell Turtle, Panda and Elephant, Wallaby and opossum are closely related species. Squirrel and Armadillo, Vervet Monkey and Orangutan shows maximum phylogenetic proximity, indicating least mutational events leading to their diversions. This analysis obeys the taxonomical arrangement of above mentioned species sharing a common ancestor from which these species evolved through time and space.
Protparam tool was applied for analyzing the physiochemical properties in fast moving species mutant proteins as well. Wild type of EGLN1 has more number of amino acids i.e. 225 whereas Mutant 1 shows less number of amino acids, i.e., 224. Mutant 1 has the more molecular weight in comparison to the wild type protein. The extinction coefficient is same for the wildtype and Mutant 1 protein. The half-life, aliphatic index and instability index have same values for both wild type and mutant 1 protein. “GRAVY” indicates the hydrophobicity of the protein [19]; more positive score indicates more hydrophobicity, results shows negative value for both wild type and Mutant 1. Motif scan tool was also used for locating motifs in the wild type protein of fast-moving species. All the fast-moving species had 2OG-Fe (II) oxygenase superfamily domain in them while same domain is also found in Mutant 1. This domain has strong match present in it and thus further analysis may or may not be required [20].
This was an initial study carried out to check the relation of hypoxia tolerance with high and low-altitude adaptations along with the ability to move at fast and slow pace, respectively. Genetic and environmental factors both have major role in the adaptive process (15). Above mentioned SNPs might be involved in this process of adaptation to different oxygen levels. This project would help in determining the fact that genetic factors also play an important role in the altitudinal adaptation process and also in evolution of species is a long, on-going process.
Conflict of interest
Authors declare that there is no conflict of interest for publishing this study.
References![]()
- Geng RQ, Wang LP. The PCR-SSCP and DNA sequencing methods detecting genetic mutations of EGLN1 gene in different sheep breeds. Indian Journal of Animal Research, (2015); 49(1).
- Shah A, Cadinu D, Henke RM, Lianoglou S, Xin X, et al. Deletion of a Subgroup of Ribosome-related Genes Minimizes Hypoxia-induced Changes and Confers Hypoxia Tolerance in Saccharomyces Cerevisiae. Physiology and Genomics, (2011); 43(14): 855-72.
- Bigham AW, Lee FS. Human high-altitude adaptation: forward genetics meets the HIF pathway. Genes & development, (2014); 28(20): 2189-2204.
- Semenza GL. Involvement of oxygen-sensing pathways in physiologic and pathologic erythropoiesis. Blood, (2009); 114(10): 2015-2019.
- Maxwell PH, Wiesener MS, Chang GW, Clifford SC, et al. The tumour suppressor protein VHL targets hypoxia-inducible factors for oxygen-dependent proteolysis. Nature, (1999); 399(6733): 271.
- Shah AN, Alam MM, Cao T, Zhang L. The Role of Ribosomes in Mediating Hypoxia Response and Tolerance in Eukaryotes. MOLECULAR MECHANISMS UNDERLYING HYPOXIA-TOLERANCE AND RESPONSE IN YEAST, (2013); 81.
- Tang Q, Huang W, Guan J, Jin L, Che T, et al. Transcriptomic analysis provides insight into high-altitude acclimation in domestic goats. Gene, (2015); 567(2): 208-216.
- Ai H, Yang B, Li J, Xie X, Chen H, et al. Population history and genomic signatures for high-altitude adaptation in Tibetan pigs. BMC genomics, (2014); 15(1): 834.
- Panariti A, Miserocchi G, Rivolta I. mRNA expression profile of selected oxygen sensing genes in the lung during recovery from chronic hypoxia. Biological research, (2013); 46(2): 169-176.
- Cho YS, Hu L, Hou H, Lee H, Xu J, et al. The tiger genome and comparative analysis with lion and snow leopard genomes. Nature Communications, (2013); 4(3433): 1-7.
- Keller I, Alexander J, Holderegger R, Edwards P. Widespread phenotypic and genetic divergence along altitudinal gradients in animals. Journal of evolutionary biology, (2013); 26(12): 2527-2543.
- Lieb ME, Menzies K, Moschella MC, Ni R, Taubman MB. Mammalian EGLN genes have distinct patterns of mRNA expression and regulation. Biochemistry and cell biology, (2002); 80(4): 421-426.
- Maxwell P. HIF-1’s relationship to oxygen: simple yet sophisticated. Cell Cycle, (2004); 3(2): 151-154.
- Udpa N, Ronen R, Zhou D, Liang J, Stobdan T, et al. Whole genome sequencing of Ethiopian highlanders reveals conserved hypoxia tolerance genes. Genome biology, (2014); 15(2): R36.
- Cheviron Z, Brumfield R. Genomic insights into adaptation to high-altitude environments. Heredity, (2012); 108(4): 354.
- West JB. High-altitude medicine. American journal of respiratory and critical care medicine, (2012); 186(12): 1229-1237.
- Fong G, Takeda K. Role and regulation of prolyl hydroxylase domain proteins. Cell death and differentiation, (2008); 15(4): 635.
- Marchler-Bauer A, Zheng C, Chitsaz F, Derbyshire MK, Geer LY, et al. CDD: conserved domains and protein three-dimensional structure. Nucleic acids research, (2012); 41(D1): D348-D352.
- Idicula-Thomas S, Balaji PV. Correlation between the structural stability and aggregation propensity of proteins. In silico biology, (2007); 7(2): 225-237.
- Tamura K, Nei M. Estimation of the number of nucleotide substitutions in the control region of mitochondrial DNA in humans and chimpanzees. Molecular biology and evolution, (1993); 10(3): 512-526.
![]()
This work is licensed under a Creative Commons Attribution-Non Commercial 4.0 International License. To read the copy of this license please visit: https://creativecommons.org/licenses/by-nc/4.0