

Full Length Research Article
Effects of Salinity Stress on Growth and Physio-biochemical Parameters of Three Pea (Pisum sativum L.) Cultivars of Different Maturity Duration
Fatima Ishrat1*, Humera Afrasiab1, Firdaus-e-Bareen2, Farman Ahmad Chaudhury3
Adv. life sci., vol. 9, no. 3, pp. 380-391, October 2022
*– Corresponding Author: Fatima Ishrat (Email: fatima-639286@pu.edu.pk)
Authors' Affiliations
2. Institute of Molecular Biology and Biotechnology, University of Lahore, Lahore – Pakistan
3. School of Food Sciences And Technology, Minhaj University Lahore – Pakistan
[Date Received: 08/30/2021; Date Revised: 12/08/2022; Date Published: 31/10/2022]
Abstract![]()
Introduction
Methods
Results
Discussion
References
Abstract
Background: Salinity is one of the leading abiotic stresses that negatively affects the growth of many important food crops and significantly reduces the productivity and yield value.
Methods: The present study was conducted to study the effects of NaCl stress on three pea (Pisum sativum) cultivars (Climax, Lina Pak and Pea-267) of different maturity level (Late, early, and mid-season flowering) under In vitro conditions. Two weeks old In vitro grown shoots of three pea cultivars were subjected to stress condition in MS medium supplemented with five levels of NaCl (0, 20, 40, 80 and 100mM NaCl) for one month and different morphological and physio-biochemical traits including length of shoot, number of leaves, shoot biomass, chlorophyll, proline and total phenolic content, total proteins and non-enzymatic antioxidant (DPPH) activities were studied.
Results: The results were analyzed using different statistical approaches (ANOVA, MNOVA, PCA, correlation and regression) to identify the tolerance level of each genotype. Shoot length and shoot fresh weight were increased at 20 and 40mM in Climax, while proline content progressively increased with an increase in stress concentration in all the genotypes. Total protein content increased in cvs. Climax and Pea-267 and decreased in Lina Pak above 20mM and DPPH was increased in Climax and Pea-267 at 20 and 40mM, while in Lina Pak it showed an increase at only 20mM NaCl concentration. According to the results of MNOVA and regression analysis, significant changes occurred in biomass, proline content and DPPH values. A strong positive correlation of shoot dry weight was found with total phenolic and proline content. Maximum value of stress tolerance index was recorded for Climax.
Conclusion: Biplot analysis clustered cvs. Climax and Pea-267 cultivars into tolerant group and Lina Pak in sensitive group based on the mean performance of studied parameters to NaCl stress and control treatments.
Keywords: Pisum sativum; Salinity tolerance; Osmoprotectants; Biplot analysis; Regression
Introduction![]()
Salinity is the main agronomic problem among abiotic stresses which negatively affect plant growth, seed germination, biomass and crop productivity resulting in economic loss and food scarcity. Salinization is increasing day by day due to poor cultural practices and irrigation problems and it is assessed that 50% land will be affected by salinity by the middle of 21st century [39, 52]. It is assessed that salinity affects 20% of cultivated land and 33% of irrigated land and this percentage is increasing annually due to expanding salinization problems. Adverse effects of salinity in agriculture are posing drastic challenges to the world food security [37]. Salinity negatively effects the growth of plants by interfering with the absorption of essential nutrients. It also reduces the growth and development and may halt the plant reproduction mechanism, which ultimately results in crop loss [43].
Accumulation of Na+ and Cl- ions in rhizosphere is toxic for plants and both ions negatively affect the growth of plants when exceeds in concentration. Na+ ions toxicity in plants decreases the intake of water and essential nutrients like calcium and potassium, which causes osmotic and nutritional imbalance and finally the death of plant [29, 34]. Cl- ions mostly accumulate in leaf tissues and when concentration increases to threshold level it becomes toxic for normal growth of plants and show the same symptoms as salt damage [23]. Ionic toxicity causes oxidative stress by destroying a number of ROS producing chains and causing water deficit by decreasing the intake of water by roots. In short term effects, salinity reduces transpiration rate by closing the stomata and elongating cellular parts, especially in growing regions. While long term effects include slowing down metabolism processes by disrupting the bioenergetic processes of photosynthesis, accelerating plant senescence and ultimately death of plants [56 49]. In addition, salt stress interrupts the process of lipid metabolism and enzyme functioning by inducing changes in fatty acid composition which is especially important for the maintenance of biological functions of membranes in plants [24].
Salinity stress also reduces the xylem hydraulic capacity and synthesis of ROS, which activates different processes in plant to reduce the flux of Na+ into roots, which is the first organ to be exposed to salt stress followed by translocation into other parts [3]. Toxic ions which enter into plant system with absorption of water are accumulated in the vacuole to avoid the negative effects on cytoplasmic process. However, variation in tolerance ability of different plants is due to their adaptive mechanisms to cope with this stress [22]. Plants have different adaptive mechanisms to overcome the stress challenges like osmotic adjustment, production of osmolyte, secondary metabolites, enzymatic and non-enzymatic antioxidant system [5]. The ability of plants to adapt stress conditions is acquired by synthesis of osmo-protectants like proline, which helps plants to survive under extreme osmotic environment without disturbing their cell metabolism [19]. Salt stress causes an increase in the protein content of plants which is important for cell survival and membrane stabilization under stress conditions and the tolerance level is associated with higher accumulation of protein content. Elevated level of antioxidants and proteins play a significant role to control the synthesis ROS to protect the cells and increase the tolerance ability of plants to several types of stresses [57]. NaCl stress causes an increase in the production of ROS, which leads to cellular and metabolic changes in plants and ultimately destruction of essential biomolecules. To minimize this damage, the plants use their antioxidant system to inhibit the production ROS chain. Tolerance of plants to salinity is a polygenic character. Several studies have shown that the resistance to stress conditions correlate with plants tolerance ability which is due to antioxidants and production of osmolytes in plants [8].
Pisum sativum L. is a winter food crop belonging to family Fabaceae (Leguminosae) which has impressive nutritious profile especially in high-quality proteins. It is an important vegetable crop which is commonly used for both food and fodder. Pea is reported to be extremely sensitive to environmental stresses like salinity and temperature etc. [38, 26]. The present experiment was designed to measure the response of three pea cultivars (Lina Pak, Climax and Pea-267) to salt stress and for screening tolerant and sensitive cultivars among them on the basis of morphological and physiological parameters. For this purpose, the data of shoot length, leaves, shoot biomass, chlorophyll, antioxidants, and protein contents were recorded and compared with each other to evaluate the stress tolerance index of pea cultivars to salt stress. Lina Pak is an early flowering cultivar and Pea-267 is mid-session while, Climax is a late flowering cultivar, and these are commonly cultivated in Pakistan. So comparative analysis of their response under salt stress is particularly important to identify their stress tolerance.
Methods![]()
Seeds germination and seedling establishment
Seeds of three pea cultivars (Climax, Lina-Pak and Pea-267) of different maturity duration were collected from Ayub Agriculture Research Institute (AARI), Faisalabad. The seeds were thoroughly washed with water and detergent to remove all the dust particles, followed by surface sterilized with 10% sodium hypochlorite solution for 12 minutes. After sterilization, the seeds were washed thrice with autoclaved water. The seeds were than inoculated on MS [42] basal medium after removing seed coat in Laminar air flow cabinet. The inoculated tubes were shifted to culture room under dark conditions for germination. Seedlings were sub-cultured to fresh MS basal medium for the period after two weeks (16h photoperiod, 23 + 2oC temperature) for shoot establishment.
Salt stress treatment
The salt NaCl was used for stress treatments and stock solutions of 500ppm of NaCl was prepared in distilled water. MS medium supplemented with different concentration of NaCl (0, 20, 40, 80 and 100mM) was prepared and the pH was maintained to 5.7-5.8 by using 1.0 N NaOH and 1.0 N HCl solutions and sterilized in autoclave at 121oC/15psi for 15minutes. The medium was poured in sterilized culture tubes and tightly wrapped to avoid contamination.
Four replicates (shoots of similar height) of each cultivar were subjected to stress treatment for a period of one month under controlled environmental conditions. To avoid stress shock, first the shoots were transferred to MS medium with low concentration of NaCl (20mM) for three days, then they were transferred to high concentration (40mM) followed by 80 and 100mM salt stress for similar number of days. The experimental plants were harvested after 30 days of stress application along with control plants for further analysis.
Morphological parameters
Morphological parameters including length of shoot (SL), number of leaves (NL), days to flowering (DFL), shoot fresh and dry weights (SFW and SDW) were recorded for each plant. Fresh weight (SFW) was noted immediately after removing shoots from culture tubes by measuring the weight of plant and for dry weight (SDW), the shoots were placed in an oven at 70oC for 2 days and dry weight was noted [27].
Photosynthetic pigments
Total chlorophyll content (Chl T) of In vitro grown (control and stress treated) shoots of all the cultivars was measured using two different methods. First simply by recording the chlorophyll value in leaves with the help of SPAD 502 Meter (Minolta, Japan) and secondly, by using the method of [6] with a few modifications. For this purpose, fresh leaves (control and stress treated) were collected from each cultivar. Approximately 0.1 g of leaves were incubated in 10ml of 80% acetone overnight at 4oC under dark conditions. The homogenates were centrifuged at 5000rpm for 10 min. and the supernatant was collected and absorption was recorded using spectrophotometer at 646.8 and 663.2nm. The solvent (acetone) without plant extract was use as blank. The total chlorophyll (Chl T) content was determined by using the formula:
Chl T = (Chla + Chlb) x (X/1000 x n)
Chl T = (20.2 A645.8+ 8.02 A663.20) x (X/1000 x n)
Chla (mg/g F.W) = (12.74 A663.20 – 2.69 A645.8) x (X/1000 x n)
Chlb (mg/g F.W) = (22.89 A645.8 – 4.72 A663.20) x (X/1000 x n)
Where A645.8 = Absorbance at 645.8nm for Chla, Where A663.2 = Absorbance at 663.2nm for Chlb, ChlT = total chlorophyll concentration, X = total volume of filtrate, n = tissue weight.
Proline content
Free proline content (PC) was measured by using the method of [12] with little modifications. For this purpose, 50mg leaf tissue of each cultivar (including control and stress treated) was homogenized with 4.0ml of 3% sulfosalicylic acid for 72hr. Then the homogenate was centrifuged at 1000rpm (10 minutes), and supernatant was collected and 1.0ml of supernatant from each treatment was mixed 2.0ml of ninhydrin acid and incubated in water bath at 100oC for 1 hour followed by cooling on ice. After cooling, 4.0ml of toluene was added to each solution and vortexed. The optical density was recorded using spectrophotometer at 520nm. Toluene without plant extract was used as blank. The PC value was estimated using the standard curve in mgg-1 unit.
Total Phenolic content
Total phenolic content (TPC) was also determined from fresh samples extract of each cultivar by using the method of Folin-Ciocalteu (FC) assay [53]. Gallic acid (GA) was used for the preparation standard curve (0-300ug/ml). Phenolic content from all the samples were extracted with 70% methanol as solvent. For this purpose, 0.5g leaves were homogenized with 5.0ml methanol for 20 minutes. The supernatant was collected after centrifugation for10 mins at 14,000 rpm. The supernatant (0.5ml) was then mixed with 2.5ml of FC reagent (10 times diluted with distilled water) and 2.0ml of Na2CO3 (75g/1000ml distilled water) and the samples were incubated at 50oC for 5.0 minutes. After cooling the samples, absorbance was recorded using spectrophotometer at 760nm. For control, distilled water was used instead plant extract. TPC in samples were measured as mg GA equivalent per gram of FW (mg GAE g-1 FW).
DPPH Radical Scavenging Assay
DPPH (1,1-diphenyl-2-picrylhy-drazyl) radical scavenging assay was used for the estimation of total antioxidant activity. Salt stress treated shoots of all the cultivars were grounded into fine powder after drying under dark condition. For preparation of plant extract, 1g of the powder sample was processed in Soxhlet apparatus by using 100ml methanol and the extract was collected and vortexed. Methanolic plant extract was prepared of different concentrations (10-50 ug/ml) by using dilution method. DPPH assay was done by following the method of [25]. For the determination of antioxidant activity, 1.0ml of methanolic plant extract was treated with 3.0ml of DPPH (0.1M) and kept in incubation for 30 minutes at room temperature. The absorbance was recorded in spectrophotometer at 517nm for all samples. The mixture of DPPH and methanol was used as control. Antioxidant activity was expressed as IC50 value which is measured by linear regression method. Low IC50 value shows high antioxidant activity and vice versa. The percentage inhibition and IC50 value was calculated by the following formula:
% inhibition = [(Abs control – Abs sample)/ (Abs control)] × 100
IC-50 = (50-b)/a where ‘a’ represent the intercept value and ‘b’ represent the slope value
Protein estimation
Total protein content (PC) was measured by using the method of [14] with slight modification. For the preparation of protein extract, the plant samples were treated with 0.1 M phosphate buffer (PBS) in 1:2 ration (w/v). Then the grounded mixture was centrifuged (14000 rpm) for 20 minutes and the supernatant was collected into another tube. For the estimation of protein in each sample, a mixture of 0.5ml of plant sample and 2.5ml of dye (Coomassie brilliant blue) was mixed and kept in incubation for 5-10 minutes at room temperature The absorbance was taken in spectrophotometer at 595nm, and the amount of protein was calculated by using the standard curve. For preparation of standard curve, seven concentrations (10, 20, 30, 40, 50, 60, and 70ug/ml) of Bovine serum albumin (BSA) was prepared from the stock solution (BSA 1.0mg/ml). For control reading, water was used with dye instead of plant sample.
Stress Tolerance Index
Dry weight-based stress tolerance Index (STI) was calculated by using the formula of [21] as follows:
STI= (Ys)(Yp)/(Yp)2
Ys = dry weight value of stress treated plant, Yp = dry weight value of control plant.
Statistical Analysis
Statistical analysis was done with SPSS Version 20.0 statistic software package. Mean values of all the studied parameters were compared by using Tuckey’s t-test in one way ANOVA (analysis of variance). Significance level was determined at P ≤ 0.05. Multivariate analysis (MANOVA) was used to calculate the coefficient of variation and standard error among the cultivars. For correlation analysis among the parameters, Pearson’s correlation test was also done to find the relationship among different traits under stress condition. Principal component analysis (PCA) was conducted for cluttering and to distinguish the relation of cultivars to the most important character under salt stress by using the Minitab 19 software.
Results![]()
We established an In vitro experiment to study the response of three pea cultivars to five levels of salt stress (0, 20, 40, 80 and 100mM NaCl) and data was recorded for growth, shoot biomass, chlorophyll, proline and protein content, total phenolic content, and antioxidant activity. A differential response was observed in all the cultivars but generally they responded positively at lower concentration (20mM) of NaCl while at the highest concentration (100mM NaCl) growth retardation was induced in all the cultivars.
Seed germination
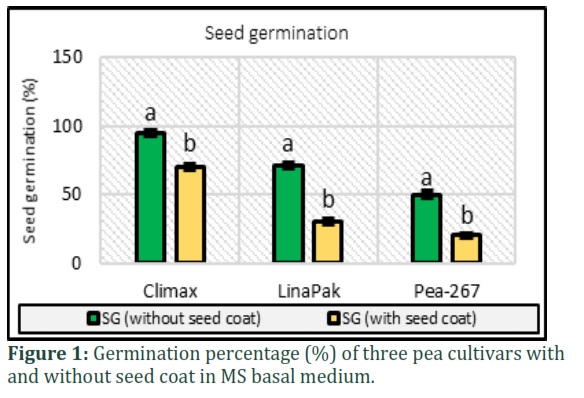
The results for germination of seeds of three pea cultivars in MS basal medium is presented in Fig. 1 which shows the mean percentage of seed germination with and without seed coat. It was observed that the percentage increased significantly when seeds were inoculated without the seed coat. Highest percentage of 95% (without seed coat) and 70% (with seed coat), was calculated for the cultivars Climax, followed by Lina Pak (71% and 30%) and Pea-267(50% and 20%) respectively.
Mean performance of three pea cultivars at different salinity (NaCl) levels
Morphological parameters
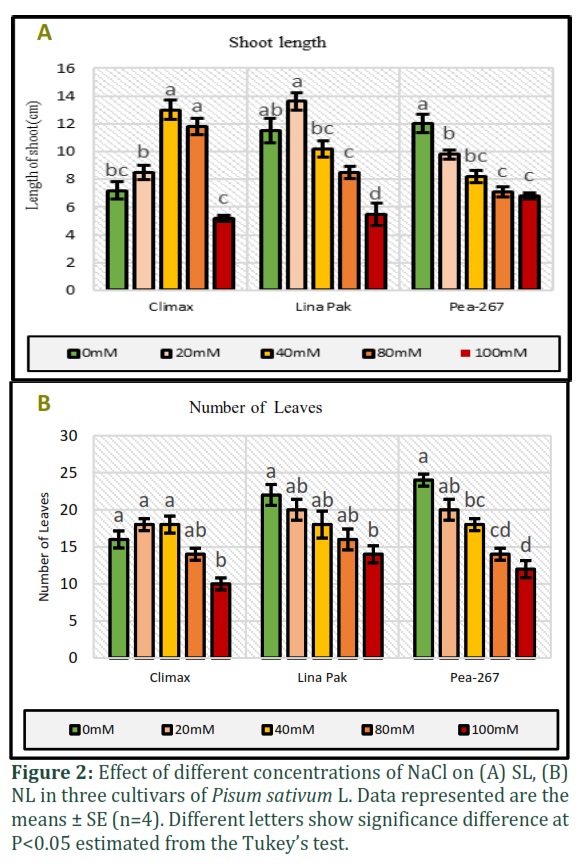
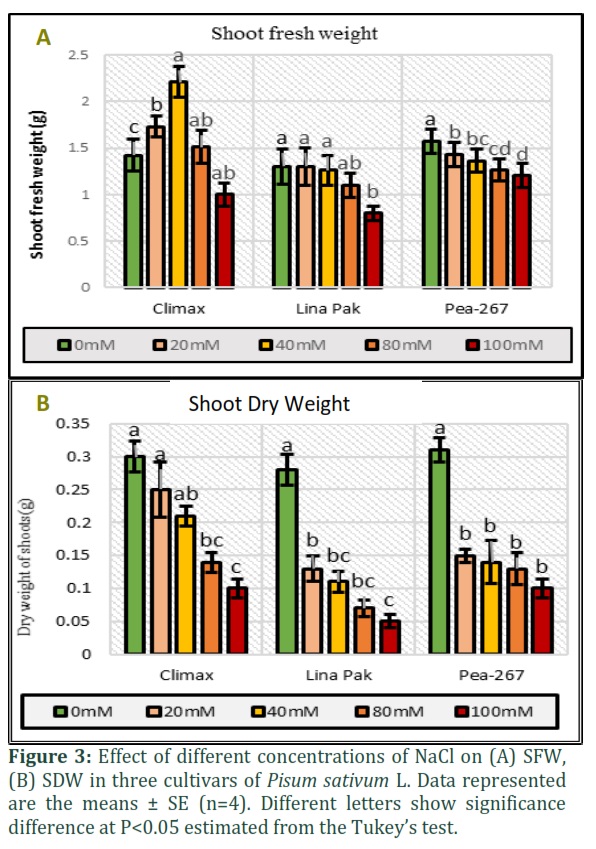
In the present study, the morphological parameters SL, NL, SFW and SDW were measured in three cultivars of pea grown under five salinity levels (Fig. 2 and Fig. 3). An increase in SL and SFW was observed in Climax and Lina Pak. Maximum increase in SL (13cm at 40mM and 7.2cm at 0mM) (Fig.2a) and SFW (2.21g at 40mM and 1.42g at 0mM) (Fig. 3a) was observed in Climax, followed by Lina Pak with slight increase in SL (13.6cm at 20mM and 11.5cm at 0mM) only, while the SFW remained constant (1.3g). The parameters NL and SDW progressively decreased with an increase in salinity level in all the cultivars. Maximum reduction in SDW was recorded in Lina Pak (0.05g at 100mM and 0.28g at 0mM NaCl) and minimum in Climax (0.1g at 100mM and 0.3g at 0mM NaCl) as shown in Fig. 2b and Fig. 3b (P<0.05).
Flowering time
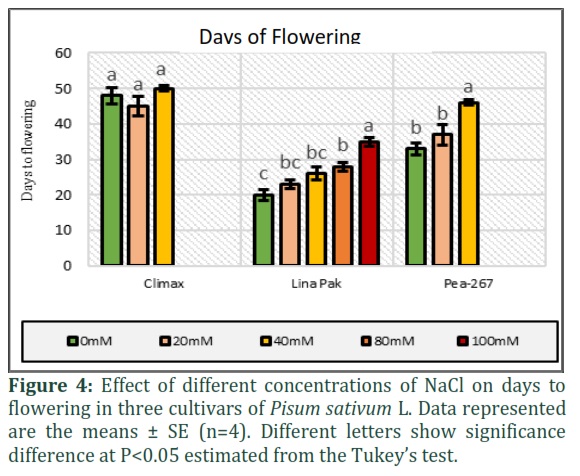
The days to flowering (DFL) was also recorded in three cultivars under control and stress conditions as given in Fig. 4. In control treatments, early flowering (20 days) was observed in Lina Pak followed by Pea-267 (33 days) and Climax (48 days) and hence considered as early, medium, and late maturing cultivars, respectively. Under the stress of NaCl, the flowering time of pea cultivars increased with an increase in stress level except for the genotype Climax, in which flowering time slightly decreased to 45 days at 20mM NaCl as compared to control (48 days) and then increased to 50 days at 40mM NaCl. No flowering was observed in Climax and Pea-267 at higher concentration of NaCl (80 and 100mM) up to 50 days of experiment.
Total Chlorophyll Content
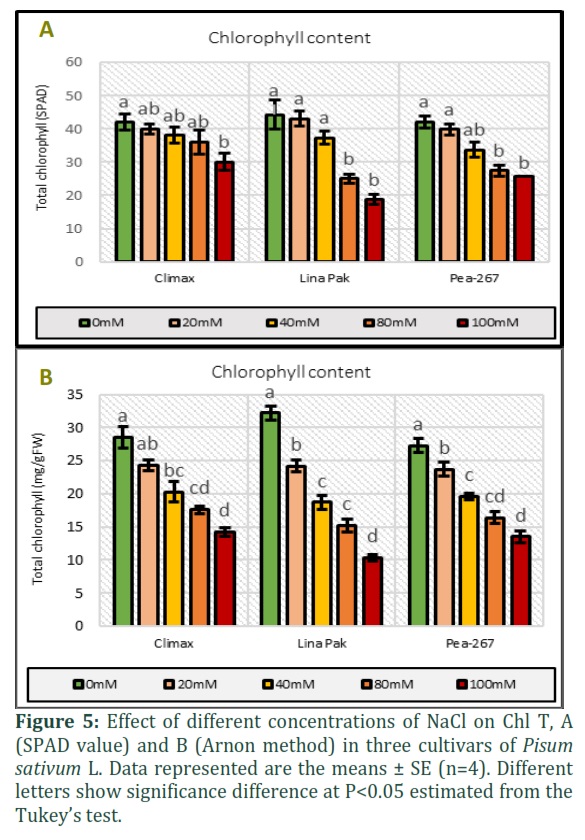
Total chlorophyll content (Chl T) was measured by SPAD meter and Arnon (1949) method in three pea cultivars under five salinity level (Figs. 5 A and B). A decreasing trend was observed in Chl T in different cultivars at all salinity levels. Maximum reduction was recorded in cultivar Lina Pak and minimum in Pea-267 in both the methods used.
Proline and Phenolic content
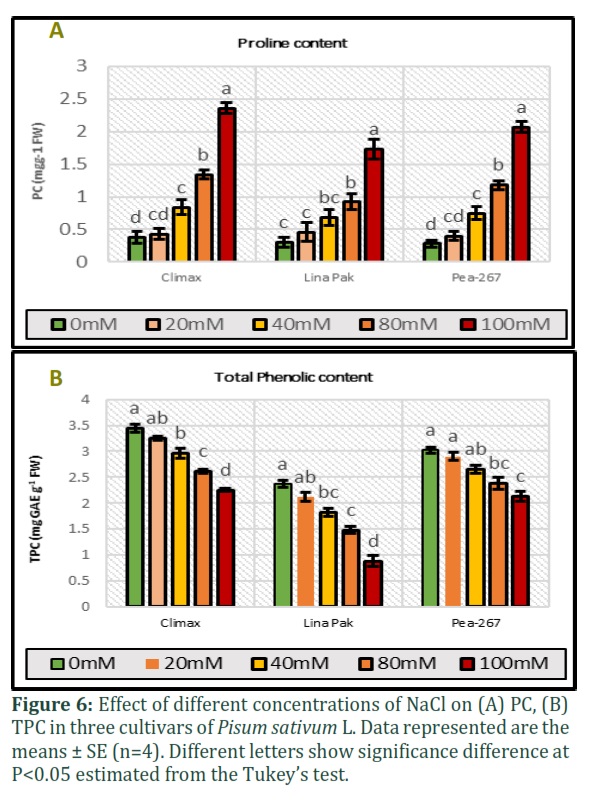
Proline content (PC) and total phenolic content (TPC) were measured in three pea cultivars under five salinity level (Fig. 6). In control treatments, highest value for PC (0.38mgg-1) and TPC (3.44mgg-1) was recorded for Climax (late maturing) followed by Pea-267 (0.30mgg-1 and 3.02mgg-1 respectively) and lowest (0.28 mgg-1 and 2.37mgg-1 respectively) in Lina Pak (early maturing). In response to NaCl stress, the level of PC increased (Fig. 6A) and level of TPC decreased (Fig. 6B) in all the cultivars in all concentrations. Maximum increase in PC was recorded in Climax and minimum increase was in Lina Pak ((2.36mgg-1 and 1.73mgg-1 at 100mM NaCl respectively). On the other hand, Climax showed minimum reduction (2.25mgg-1) in TPC and maximum reduction (0.88mgg-1) was in Lina Pak at 100mM NaCl (P<0.05).
Total protein and DPPH scavenging activity
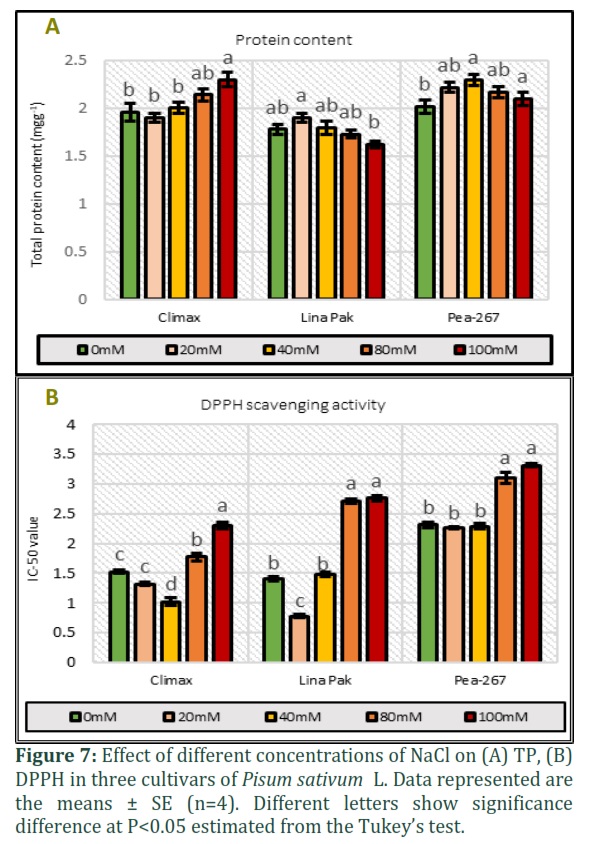
The results of total protein (TP) and DPPH scavenging activity (IC-50 value) in response to five level of NaCl is given in Fig. 6. The IC-50 is the amount of plant antioxidants required to decrease the initial DPPH concentration by 50%, which means that the low value represents the higher antioxidant activity in plant and vice versa. A differential response of DPPH and TP was observed in pea cultivars in response to NaCl stress. In Climax and Pea-267, IC-50 value decreased up to 40mM NaCl stress (1.07 and 2.29 respectively) and in Lina Pak IC-50 decreased to only 20mM NaCl (0.78) as compared to control treatment (1.52, 1.41 and 2.31 respectively). Later the IC-50 value increased in Climax, Pea-267 and Lina Pak (Fig 7A, P<0.05). While on the other hand, TP progressively increased in Climax and Pea-267 with increase in NaCl concentration (2.3mgg-1 and 2.1mgg-1 at 100mM respectively) and in Lina Pak an increase in TP was observed up to 40mM NaCl (1.8mgg-1) as compared to control treatments (1.96, 1.78 and 2.02mgg-1 respectively). However maximum increase in TP and antioxidant activity was recorded in Climax (Fig. 7B, P<0.05).
Stress Tolerance Index
The Stress tolerance index (STI) of three pea cultivars was formulated by SDW at medium stress STI-1 (40mM NaCl) and high stress STI-2 (100mM NaCl) level as shown in Fig. 8. Maximum STI was recorded for Climax (0.7 STI-1 and 0.33 STI-2) and minimum for Lina Pak (0.39 STI-1, 0.17 STI-2).
Multivariate Correlation Analysis
Variation analysis and stress level for studied parameters
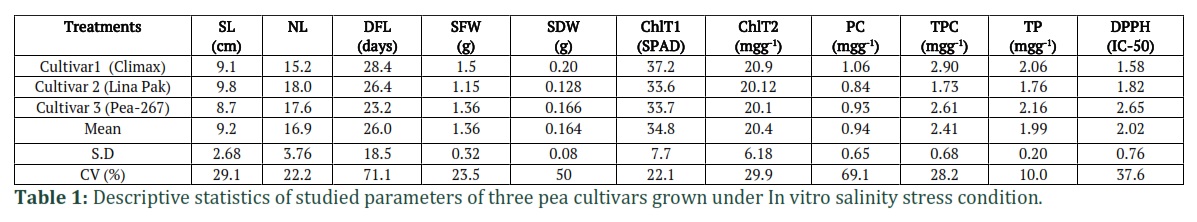
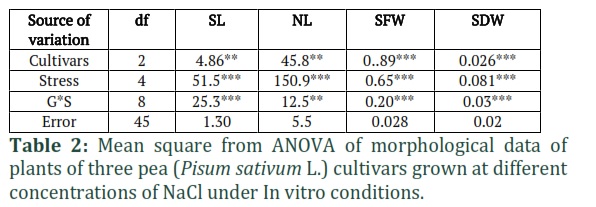
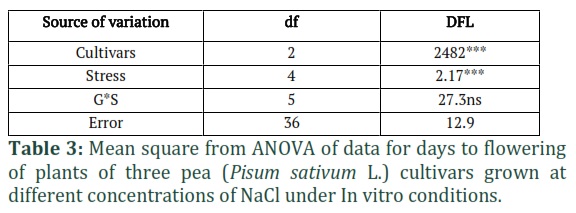
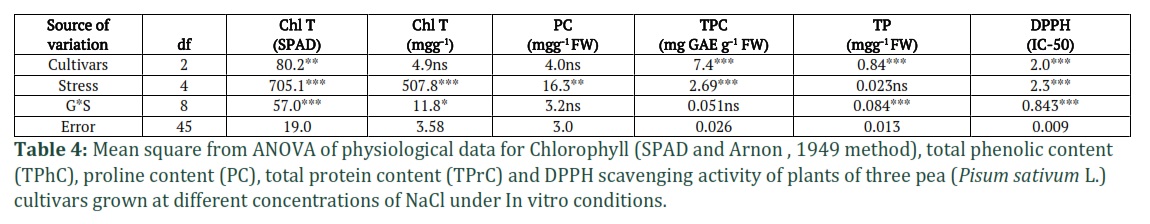
The results of MNOVA are presented in Table 1, which demonstrate that NaCl stress significantly affected the growth, biomass, and different physio-biochemical parameters of pea cultivars. According to the descriptive statistical results (Table 1), the highest CV is recorded for PC (69.1%) followed by SDW (50%) and DPPH activity (37.6%) and minimum for TP (10%). The results of Two-way ANOVA (Tables 2, 3 and 4) showed significant differences between cultivars (C) and NaCl stress (S) for all parameters. In morphological parameters, the difference between cultivars and stress were highly significant as P ≤ 0.01 for SFW and SDW as mentioned in Table 2 and were less significant NL (P≤0.05) and for DFL, the results were also highly significant (P≤0.01) (Table 3). In case of physio-biochemical parameters, the difference between cultivars were highly significant (P≤0.01) for DPPH, TP and TPC and non-significant (P≥0.05) for Chl and PC (Table 4). Under stress, the differences were highly significant (P≤0.01) for DPPH, TPC and Chl, less significant (P≤0.05) for PC and non-significant for TP (Table 4). The C x S interaction was also highly significant (P≤0.01) for SL, SFW, SDW, DPPH, TP and Chl (SPAD), less significant for NL, Chl (Arnon,1949) and non-significant for DFL, TPC and TP (Tables 2, 3 and 4).
Pearson’s Correlation Matrix
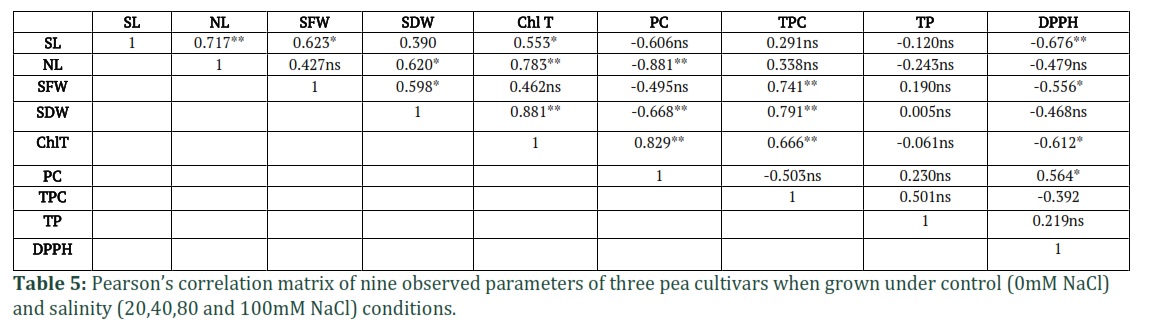
Pearson’s correlation matrix was used to find out the relationship among the nine parameters by using the combined mean data of five (0, 20, 40, 80 and 100) NaCl stress level (Table 5). The data showed significant positive correlation of PC with Chl T (r = 0.829, P = 0.01) and DPPH (r = 0.564, P = 0.05) and negative correlation with NL (r = -0.881, P = 0.01) and SDW (r = 0.668, P = 0.01). The TPC showed significant positive correlation with SDW (r = 0.791, P = 0.01), SFW (r = 0.741, P = 0.01) and Chl T (r = 0.666, P = 0.01). The DPPH negatively correlated to SL (r = -0.676, P = 0.01) and Chl T (r = -0.612, P = 0.05). SDW positively correlated to NL (r = 0.620, P = 0.05). The parameter TP was recorded as being insignificant for all the observed parameter and showed maximum non-significant correlation with only TPC (r = 0.50, P > 0.05).
Principal Component Analysis
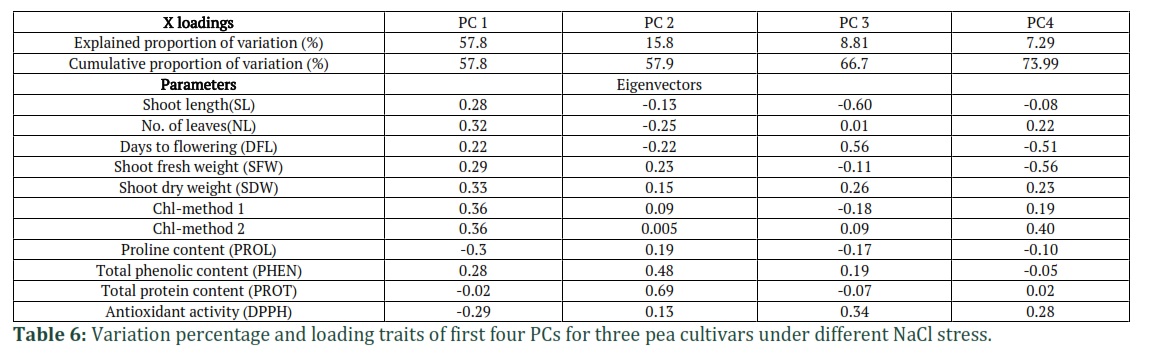
Principal Component Analysis (PCA) was used for clustering pea cultivars into tolerant and sensitive group based on the mean data of observed parameters and maturing duration (Table 6, Fig. 13). The first four principal components (PCs) contribute to a total of 73.9% variability among the nine observed parameters. PC 1 contributed 57.8%, PC 2 with 15.8%, PC 3 with 8.81% and PC 4 with 7.29% variation. The PC1 was mostly related to Chl T and different morphological parameters (SL, NL, SFW, SDW). The PC2 is important for TPC and TP and PC 3 for DFL and DPPH. In PC 4, the parameters SFW and Chl T were prominent (Table 6).
A biplot analysis was used for clustering of the total 15 samples (five from each cultivar) into distinct groups based on first two principal component (PC1 and PC2) as presented in Fig. 13. The results showed that the six samples of two cultivars, Climax and Pea-267 are present in the PC1 positive region (box I) under control (0mM NaCl), Stress 1 (20mM NaCl) and stress 2 (40mM NaCl) conditions and hence considered as group 1 (most tolerant to medium stress ). The most distinguished parameters that added to tolerance level under control and two stress conditions were TP, TPC, SFW, SDW and Chl T (Fig 9). The correlation of samples in PC1 (box I) with DPPH is negative because low IC-50 value showed higher antioxidant activity in these cultivars under two stress conditions (stress 1 and stress 2). Three samples of Lina Pak were present in PC1 (box II) related to control stress 1 (20mM NaCl) and stress 2 (40mM NaCl) and named as group 2 (tolerant to medium stress). The most significant parameters of group 2 were DFL, SL and NL. For stress 3 and stress 4 (80 and 100mM NaCl), four samples of two cultivars (Climax and Pea-267) were in group 3 (PC2, box III) with distinguishing characters of higher TP, PC and DPPH (low antioxidant) and hence suggested as slightly tolerant to higher stress. Two samples of Lina Pak from stress-3 and stress-4 (80 and 100mM NaCl) were present in PC2 (box IV) suggesting being sensitive to higher stress (group 4) because they are away from the center with maximum reduction in observed growth parameters (Fig. 9).
Regression Analysis
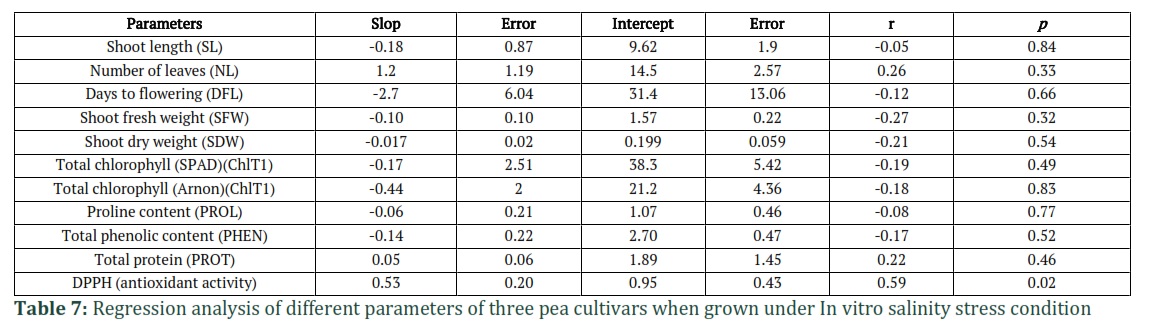
Linear regression was also used to predict the most affected parameters under NaCl stress (Table 7). The Table includes the Intercept and slop value (standardized coefficient), r (unstandardized coefficient), and P values. The results in Table 7 shows that the parameters, DPPH, NL, TP, SFW and SDW were greatly affected by increasing NaCl stress level. While SL was least affected by NaCl stress followed by DFL and TPC (Table 7).
Figures & Tables
Climate change and water scarcity, as well as heavy metal pollution, have become global issues especially in terms of the yield of food crops [22]. The effect of Ni heavy metal and water stress on morphology and anatomy of Cucurbita pepo has been studied in this study. The seed germination increased under both metal and drought stress and these results are consistent with the previous studies [23]. T experiment showed the best results of seed germination because in the T experiment Cucurbita pepo received no metal (Ni) and drought stress. Plants remain healthy and therefore best germination.
The ability of plants to survive under stress conditions is significantly associated with various physiological pathways and biochemical process that help the plants to keep osmotic balance, normal working of photosynthetic machinery and maintain ionic balance. Essential pathways include the synthesis of osmolytes, antioxidant to stop the production of free radical chains and special proteins which stabilize the membrane structure [47]. The study of stress related traits provides a basic platform for the selection of stress tolerant genotypes that can survive under extreme stress conditions. The objective of the present study was to categorize the tolerant cultivars of pea (Pisum sativum L.) by studying and comparing their different morphological and physio-biochemical traits under different salinity levels. The tolerant cultivars showed better growth, maintained biomass, and gave high yield in both normal and stress conditions. The results were based on the statistical results of ANOVA, principal component analysis (PCA), correlation and regression analysis. The results of descriptive statistics (Table 1) showed the presence of high variation in different characteristics of pea germplasm under different NaCl stress. The significant changes occurred in maturation time, proline content and dry weight of shoots. While in results of Two-way ANOVA, highly significant differences were recoded for SFW, SDW and DPPH among cultivars, stress levels and CxS interaction (Table 2 and 4). Increasing salinity delayed flowering time, reduce the biomass, and caused increase in osmoprotectants due to cytotoxicity, osmotic imbalance, and nutrient deficit [16, 32, 51 ]. In our results, the mean performance of three cultivars increased at lower NaCl (20 and 40mM) stress as the value of SL, SFW, TP, PC and DPPH increased (Fig. 2A, Fig. 3A, Fig. 6A, Fig. 7A, Fig. 7B) while the values decreased at higher concentration (80 and 100mM). However, the decreasing trend was more obvious in sensitive cultivar such as Lina Pak. Other traits including NL, SDW, Chl T, and TPC gradually decreased with an increase in NaCl level (Fig. 2B, Fig. 3B, Fig. 5, and Fig. 6B). Reduction rate was comparatively less in salt tolerant cultivars such as in Climax and Pea-267 in response to different NaCl concentration (Table 1). The delay in flowering time is due to decrease in synthesis of proteins which are specifically associated with the induction of flowers [46]. The increase in SL and SFW of tolerant cultivars at low stress is attributed towards the positive effects of sodium and chloride ions. These ions are essential micronutrients of plants and participate in various physiological processes. At optimum concentration, the Na+ ions assist the plant to build osmotic potential and sustain turgor pressure while Cl- ions cause the elongation of cells, increase the leaf area and plant biomass, and also improve the water and nitrogen use efficiency. But when the accumulation of ions exceeds in plant cells, they arrest the cell development due to increase in ions toxicity and water and nutrient deficit [45, 17, 18]. In our results, better performance of salt tolerant cultivars exhibited the highest increase in PC and DPPH activity (Fig. 6A and Fig. 7B) under stress. While the difference of PC was non-significant in cultivars and CxS interaction (Table 4). It is reported that proline and antioxidant activity increase in pea in response to salt stress [4, 44]. Similar findings are also supported in salt stressed barley, green gram, and wheat [20, 41, 55]. Under the stress condition, synthesis of proline occurs both in chloroplast and cytoplasm through glutamate and ornithine pathways [31]. Proline is a beneficial solute and improves the growth and other physiological traits of plants and also help them to recover from damages of stress. Proline increases the antioxidant activity and decreases the uptake of Na+ and Cl- ions to alleviate the effects of NaCl on plants [19]. Antioxidant decreases the oxidative stress in plants by impeding the proliferation of ROS synthesis. Tolerant genotypes exhibit higher level of osmoprotectants and non-enzymatic antioxidants in stress condition which help them to maintain the process of cell division and development [30, 50]. In the present work, it was observed that TP increased in pea plant and more significantly in tolerant cultivars and decreased at higher concentration of NaCl stress (Fig. 7A). Comparable results were also reported by Qados [48] and Khalid and Aftab [33] that protein content increased at lower concentration and decreased at higher concentration of NaCl stress in bean and potato, respectively. The increase in protein content under stress is attributed towards synthesis of salt responsive proteins like glycine-rich proteins and proline-rich proteins etc. While a decline in protein content at higher NaCl stress is due to low potassium content which is necessary for synthesis of proteins compounds [10, 36]. It is also reported that high proline content negatively affects the protein synthesis in plants by destabilizing the secondary structure of proteins. Under water deficit, proline has no relation with osmotic adjustment in plants [28, 13]. Some statistical strategies have been employed in the current study for screening of sensitive and tolerant cultivars of pea in response to NaCl stress. In screening programs, multivariate analysis (MNOVA), correlation, principal component analysis (PCA) and regression approaches are widely used for the detection of tolerant cultivars in different ways [7]. Synthesis of osmoprotectants and maintenance of biomass are tolerance indices that differently showed by different genotypes [15]. In the current study, the results of regression analysis showed significant effects of NaCl stress on DPPH, NL, SFW and SDW, while minimum effects on SL, DFL and TPC (Table 7). Estimation of Stress tolerance index (STI) is also a powerful way to identify the tolerant genotypes [35]. In the present study, the cultivar with minimum reduction in dry weight showed higher tolerance towards NaCl stress (Fig. 3B). A significant positive correlation was found of SDW with Chl T and TPC and PC with DPPH (Table 5). Minh et al., [40] also reported marked reduction of shoot dry weight and phenol content in salt sensitive cultivars of rice as compared to the tolerant cultivars under salinity. Similarly, [9] also reported a strong positive correlation between shoot dry weight and phenol content in wheat genotypes under NaCl stress. Proline and antioxidants showed positive correlation under NaCl stress [11]. The results obtained from PCA, clustered the pea cultivars into distinct groups (tolerant, slightly tolerant, and sensitive) and determined the tolerance level of each cultivar to different level of NaCl stress (Fig. 9). Similar approach has been used by many researchers to cluster the genotypes into tolerant and sensitive group in tomato [54] Faba bean [2] Kiwifruit [1].
The results of the present study showed that low level of NaCl (20mM) improved the performance of pea cultivars in term of their growth, fresh weight, and various biochemical compounds (protein, proline, and non-enzymatic antioxidants) but becomes toxic above the level of 40mM due to reduction in studied parameters. The proline, proteins and antioxidant activity increased under stress to minimize the toxic effects of NaCl. Three cultivars, Climax, Lina Pak and Pea-267 showed different tolerance level towards NaCl stress. According to the results, the minimum reduction in growth, biomass, chlorophyll, and phenolic compounds was observed in Climax followed by Pea-267 and Lina Pak along with the higher accumulation of proline, proteins, and antioxidant activity. The results of PCA indicates that Climax and Pea-267 are identified as more tolerant pea cultivars while Lina Pak represents a sensitive cultivar under applied NaCl stress. However, the present findings could be evaluated through molecular techniques to unreveal the adaptive mechanism related to NaCl stress.
Author Contributions
This article is a part of the PhD dissertation of F.I. H.A. and F.B are the supervisor and co-supervisor, respectively. The experiments were performed, and data was analyzed, and the first draft of the manuscript was written by F.I. H.A. and F.B. revised the manuscript. All the authors read and finalized the manuscript.
![]()
References
- Abid M, Zhang YJ, Li Z, Bai DF, Zhong YP, Fang JB. Effect of salt stress on growth, physiological and biochemical characters of four kiwifruit genotypes: Scientia Horticulturae, (2020); 271: 109473.
- Afzal M, Alghamdi SS, Migdadi HH, El-Harty E, Al-Faifi SA. Agronomical and physiological responses of Faba bean genotypes to salt stress: Agriculture, (2022); 12(2): 235.
- Ahanger MA, Tomar NS, Tittal M, Argal S, Agarwal R. Plant growth under water/salt stress: ROS production; antioxidants and significance of added potassium under such conditions: Physiology and Molecular Biology of Plants, (2017); 23(4): 731-744.
- Ahmad P, John R, Sarwat M, Umar S. Responses of proline, lipid peroxidation and antioxidative enzymes in two varieties of Pisum sativum L. under salt stress: International Journal of Plant Production, (2012); 2(4): 353-366.
- Arbona V, Manzi M, Zandalinas SI, Vives-Peris V, Perez-Clemente RM, Gomez-Cadenas A. Physiological, metabolic, and molecular responses of plants to abiotic stress. In: Stress Signaling in Plants: Genomics and Proteomics Perspective, (2017); 2:1-35.
- Arnon DI. Copper enzymes in isolated chloroplasts. Polyphenoloxidase in Beta vulgaris: Plant Physiology, (1949); 24: 1-15.
- Arzu KOSE, Onder O, Bilir O, Kosar F. Application of multivariate statistical analysis for breeding strategies of spring safflower (Carthamus tinctorius L.): Turkish Journal of Field Crops, (2018); 23(1): 12-19.
- Ashraf MPJC, Harris PJC. Potential biochemical indicators of salinity tolerance in plants: Plant Science, (2004); 166(1): 3-16.
- Ashraf MA, Ashraf MUHAMMAD, Ali Q. Response of two genetically diverse wheat cultivars to salt stress at different growth stages: leaf lipid peroxidation and phenolic contents: Pakistan Journal of Botany, (2010); 42(1): 559-565.
- Ayala-Astorga GI, Alcaraz-Meléndez, L. Salinity effects on protein content, lipid peroxidation, pigments, and proline in Paulownia imperialis (Siebold & Zuccarini) and Paulownia fortunei (Seemann & Hemsley) grown in vitro: Electronic Journal of Biotechnology; (2010); 13(5): 13-14.
- Banu MNA, Hoque MA, Watanabe-Sugimoto M, Matsuoka K, Nakamura Y, Shimoishi Y, Murata Y. Proline and glycine-betaine induce antioxidant defense gene expression and suppress cell death in cultured tobacco cells under salt stress: Journal of Plant Physiology, (2009); 166(2): 146-156.
- Bates LS, Waldren RP, Teare ID. Rapid determination of free proline for water-stress studies: Plant Soil, (1973) 39: 205–207.
- Borgo L, Marur CJ, Vieira LGE. Effects of high proline accumulation on chloroplast and mitochondrial ultrastructure and on osmotic adjustment in tobacco plants. Acta Scientiarum: Agronomy, (1973); 37: 191-199.
- Bradford MM. A rapid and sensitive method for the quantitation of microgram quantities of protein utilizing the principle of protein-dye binding: Analytical Biochemistry, (1976); 72(1-2): 248-254.
- Cai ZQ, Gao Q. Comparative physiological and biochemical mechanisms of salt tolerance in five contrasting highland quinoa cultivars: BMC Plant Biology, (2020); 20(1): 1-15.
- Castillo EG, Tuong TP, Ismail AM, Inubushi K. Response to salinity in rice: Comparative effects of osmotic and ionic stresses: Plant Production Science, (2007); 10(2): 159-170.
- Chen H, Jiang JG. Osmotic adjustment and plant adaptation to environmental changes related to drought and salinity: Environmental Reviews, (2010): 18(NA); 309-319.
- Colmenero-Flores JM, Franco-Navarro JD, Cubero-Font P, Peinado-Torrubia P, Rosales MA. Chloride as a beneficial macronutrient in higher plants: new roles and regulation: International Journal of Molecular Sciences, (2019); 20(19): 4686.
- Dar MI, Naikoo MI, Rehman F, Naushin F, Khan FA. Proline accumulation in plants: roles in stress tolerance and plant development. In: Osmolytes and plants acclimation to changing environment: Emerging omics technologies, (2016); 155-166. Springer, New Delhi.
- Fedina IS, Georgieva K, Grigorova I. Light-dark changes in proline content of barley leaves under salt stress: Biologia Plantarum, (2002); 45(1): 59-63.
- Fernandez, GC. Effective selection criteria for assessing plant stress tolerance. In: Proceeding of the International Symposium on Adaptation of Vegetables and other Food Crops in Temperature and Water Stress: Aug 13-16; Shenhua, Taiwan, (1992): 257-270.
- Flowers TJ, Munns R, Colmer TD. Sodium chloride toxicity and the cellular basis of salt tolerance in halophytes: Annals of Botany, (2015); 115(3): 419-431.
- Geilfus CM. Chloride: From nutrient to toxicant: Plant and Cell Physiology, (2018); 59(5): 877-886.
- Guo Q, Liu L, Rupasinghe TW, Roessner U, Barkla BJ. Salt stress alters membrane lipid content and lipid biosynthesis pathways in the plasma membrane and tonoplast: Plant Physiology, (2022); 189(2): 805-826.
- Gyamfi MA, Yonamine M, Aniya Y. (1999). Free-radical scavenging action of medicinal herbs from Ghana: Thonningia sanguinea on experimentally induced liver injuries. General Pharmacology: The Vascular System, 32(6): 661-667.
- Hattab S, Dridi B, Chouba L, Kheder MB, Bousetta H. (2009). Photosynthesis and growth responses of pea Pisum sativum L. under heavy metals stress: Journal of Environmental Science, 21(11): 1552-1556.
- Huang P, de-Bashan L. Evidence that fresh weight measurement is imprecise for reporting the effect of plant growth-promoting (rhizo) bacteria on growth promotion of crop plants. Biology and Fertility of Soils, (2017); 53: 199-208.
- Imai K, Mitaku S. Mechanisms of secondary structure breakers in soluble proteins: Biophysics, (2005); 1: 55-65.
- Kamran M, Parveen A, Ahmar S, Malik Z, Hussain S, Chattha, MS, Chen JT. An overview of hazardous impacts of soil salinity in crops, tolerance mechanisms, and amelioration through selenium supplementation: International Journal of Molecular Sciences, (2020); 21(1): 148.
- Kasote DM, Katyare SS, Hegde MV, Bae, H. Significance of antioxidant potential of plants and its relevance to therapeutic applications: International Journal of Biological Sciences, (2015); 11(8): 982.
- Kavi Kishor PB, Sreenivasulu NESE. Is proline accumulation per se correlated with stress tolerance or is proline homeostasis a more critical issue?: Plant, Cell & Environment, (2014); 37(2): 300-311.
- Kazan K, Lyons R. The link between flowering time and stress tolerance: Journal of Experimental Botany, (2016); 67(1): 47-60.
- Khalid A, Aftab F. Effect of exogenous application of IAA and GA3 on growth, protein content, and antioxidant enzymes of Solanum tuberosum L. grown in vitro under salt stress: In Vitro Cellular & Developmental Biology-Plant, (2020); 56(3): 377-389.
- Kumar S, Li G, Yang J, Huang X, Ji Q, Liu Z, Hou H. Effect of salt stress on growth, physiological parameters, and ionic concentration of water dropwort (Oenanthe javanica) cultivars: Frontiers in Plant Science, (2021);12.
- Kumawat KR, Gothwal DK, Singh, D. Salinity tolerance of lentil genotypes based on stress tolerance indices: Journal of Pharmacognosy and Phytochemistry, (2017); 6: 1368-1372.
- Li W, Zhao FA, Fang W, Xie D, Hou J, Yang X, Lv S. Identification of early salt stress responsive proteins in seedling roots of upland cotton (Gossypium hirsutum L.) employing iTRAQ-based proteomic technique: Frontiers in Plant Science, (2015); 6: 732.
- Machado RMA, Serralheiro RP. Soil salinity: effect on vegetable crop growth. Management practices to prevent and mitigate soil salinization: Horticulturae, (2017); 3(2): 30.
- Manchanda G, Garg N. Salinity and its effects on the functional biology of legumes: Acta Physiologiae Plantarum, (2008); 30(5): 595-618.
- Miljus-Djukic J, Stanisavljevic N, Radovic S, Jovanovic Z, Mikic A, Maksimovic V. Differential response of three contrasting pea (Pisum arvense, P. sativum and P. fulvum) species to salt stress: Assessment of variation in antioxidative defense and miRNA expression: Australian Journal of Crop Science, (2013); 7(13): 2145-2153
- Minh LT, Khang DT, Ha PT, Tuyen PT, Minh TN, Quan NV, Xuan TD. Effects of salinity stress on growth and phenolics of rice (Oryza sativa L.): International Letters of Natural Sciences, (2016); 57.
- Misra N, Gupta AK. Effect of salt stress on proline metabolism in two high yielding genotypes of green gram: Plant Science, (2005); 169(2): 331-339.
- Murashige T, Skoog F. A revised medium for rapid growth and bioassays with tobacco tissue cultures: Physiologia Plantarum, (1962); 15: 473-97.
- Okon OG. Effect of salinity on physiological processes in plants. In: Microorganisms in saline environments: Strategies and functions, (2019); 237-262: Springer, Cham.
- Ozturk L, Demir Y, Unlukara A, Karatas I, Kurunc A, Duzdemir O. Effects of long-term salt stress on antioxidant system, chlorophyll, and proline contents in pea leaves: Romanian Biotechnological Letters, (2012); 17(3): 7227-7236.
- Pardo JM, Quintero FJ. Plants and sodium ions: Keeping company with the enemy: Genome Biology, (2002); 3(6): 1-4.
- Park HJ, Kim WY, Yun DJ. A role for GIGANTEA: keeping the balance between flowering and salinity stress tolerance: Plant Signaling and Behavior, (2013); 8(7): 24820.
- Polash MAS, Sakil MA, Hossain MA. Plants responses and their physiological and biochemical defense mechanisms against salinity: a review: Tropical Plant Research, (2019); 6: 250-274.
- Qados AMA. Effect of salt stress on plant growth and metabolism of bean plant Vicia faba (L.): Journal of the Saudi Society of Agricultural Sciences, (2011); 10(1): 7-15.
- Ru QM, Xiao Q, Lin P, Pei ZM, Zheng HL. Short-and long-term effects of NaCl on physiological and biochemical characteristics in leaves of a true mangrove Kandelia candel: Russian Journal of Plant Physiology, (2009); 56(3): 363-369.
- Sarker U, Oba S. The response of salinity stress-induced A. tricolor to growth, anatomy, physiology, non-enzymatic and enzymatic antioxidants: Frontiers in Plant Science, (2020); 11: 559876.
- Sharif I, Aleem S, Farooq J, Rizwan M, Younas A, Sarwar G, Chohan SM. Salinity stress in cotton: effects, mechanism of tolerance and its management strategies: Physiology and Molecular Biology of Plants, (2019); 25(4): 807-820.
- Shrivastava P, Kumar R. Soil salinity: A serious environmental issue and plant growth promoting bacteria as one of the tools for its alleviation: Saudi Journal of Biological Sciences, (2015); 22(2): 123-131.
- Singleton V L, Orthofer R, Lamuela-Raventos RM. Analysis of total phenols and other oxidation substrates and antioxidants by means of folin-ciocalteu reagent. In: Methods in enzymology, (1999): 299; 152-178: Academic Press.
- Sivakumar J, Prashanth JEP, Rajesh N, Reddy, SM, Pinjari OB. Principal component analysis approach for comprehensive screening of salt stress-tolerant tomato germplasm at the seedling stage: Journal of Biosciences, (2020); 45(1): 1-11.
- Yassin M, El Sabagh A, Mekawy AMM, Islam MS, Hossain A, Barutcular C, Saneoka H. Comparative performance of two bread wheat (Triticum aestivum L.) genotypes under salinity stress: Applied Ecology and Environment Research, (2019): 17(2); 5029-5041.
- Yeo AR, Lee ΛS, Izard P, Boursier PJ, Flowers TJ. Short-and long-term effects of salinity on leaf growth in rice (Oryza sativa L.): Journal of Experimental Botany, (1991); 42(7): 881-889.
- Zhang M, Fang Y, Ji Y, Jiang Z, Wang L. Effects of salt stress on ion content, antioxidant enzymes and protein profile in different tissues of Broussonetia papyrifera: South African Journal of Botany, (2013); 85: 1-9.
This work is licensed under a Creative Commons Attribution-Non Commercial 4.0 International License. To read the copy of this license please visit: https://creativecommons.org/licenses/by-nc/4.0