
Full Length Research Article
The correlation between Fibroblast Growth Factor and Diabetic Nephropathy in Patients with Type 2 Diabetes
Sarah S. Jabbar1*, Sanad B. Mahmmad1,2
Adv. life sci., vol. 12, no. 3, pp. 466-470, August 2025
*- Corresponding Author: Sarah S. Jabbar (Email: sarahsattar@uotelafer.edu.iq)
Authors' Affiliations
2. Department of Chemistry, University of Baghdad, College of Science for Women, Al-Jadriya, Baghdad – Iraq
[Date Received: 17/11/2023; Date Revised: 05/11/2024; Available Online: 31/10/2025]
Abstract![]()
Introduction
Methods
Results
Discussion
References
Abstract
Background: Diabetic nephropathy (DN) is a common microvascular complication of advanced-stage diabetes mellitus. Its pathogenesis is via redox imbalance, cytokine kinetics, genetics, metabolism, and microvascular dysfunction involving the kidneys. DN causes proteinuria, edema, and hypertension, which can lead to kidney failure. Type 2 diabetes, high blood pressure, high-protein diet, and smoking are recognized risk factors. Fibroblast Growth Factor (FGF) regulates significant physiological activities and is engaged in DN, but its definitive mechanism is unclear.
Methods: In this study, 135 participants took part: 90 patients with DN (53 men, 37 women) and 45 controls. Patients were separated into:
- Type 2 diabetes with normal-to-borderline albuminuria (n = 45; 26 males, 19 females; ACR typically < 30 mg/g creatinine, though participants with occasional readings up to 60 mg/g were included to account for day-to-day variation in urinary albumin excretion). However, the descriptive statistics (Table 3) showed that the mean ACR in this group was 47.96 ± 38.34, suggesting that the cutoff criterion may not align with the data, or that patients were misclassified. The definition should therefore be interpreted with caution.
- Type 2 with microalbuminuria (n = 23; 16 males, 7 females; ACR = 30–300 mg/g creatinine).
- Type 2 with macroalbuminuria (n = 22; 11 men, 11 women; ACR > 300 mg/g).
The study was conducted at Telafer Hospital (April 2021–June 2022). Serum FGF was measured using an ELISA kit. Blood (5 mL) was left to clot at room temperature for 20 minutes; the clotted blood was centrifuged at 4000 rpm for 10 minutes to separate serum. Serum fibroblast growth factor (FGF) concentration was expressed in picograms per millilitre (pg/mL). Fasting blood sugar (FBS) was measured in milligrams per decilitre (mg/dL), albumin-to-creatinine ratio (ACR) in milligrams per gram of creatinine (mg/g), and glycated haemoglobin (HbA1c) as a percentage (%).
Results: s-FGF levels were significantly higher in DN groups than controls (p < 0.001). FBS, HbA1c, and ACR were also elevated.
Conclusion: ACR is a leading early diagnostic marker of DN. FGF is a strong candidate for a diagnostic and a disease progression-tracking biomarker in DN.
Keywords: Fibroblast growth factor, diabetic nephropathy, type 2 diabetes
Introduction![]()
Chronic microvascular problems are associated with a metabolic disease called diabetes mellitus (DM). Numerous serious issues are brought on by diabetes; these include diabetic nephropathy (DN), diabetic foot ulcers, and diabetic retinopathy. Among these illnesses, DN is the main cause of end-stage renal disease (ESRD) worldwide [1]. Long-term vascular and microvascular disease, which is well-known and is associated with diabetes, is called DN [2]. Insulin resistance (IR) and aberrant insulin secretion are the pathophysiology of Type 2 diabetes mellitus [3]. Type 2 diabetes, constituting the majority of diagnosed cases between 90 and 95%, has become a challenge [4]. Multiple interrelated pathways contribute to the altered blood levels of most hormones in advanced diabetes mellitus [5]. Diabetic kidney disease (DKD) has been significantly impacted by the rise in the number of persons getting diabetes. Diabetic kidney disease (DKD) and other kidney disorders are widespread chronic ailments, even though DKD is the term used to describe kidney disease caused by diabetes. Therefore, diabetes itself might be the root of chronic kidney disease (CKD) among those affected by the former. It’s worth mentioning that diabetes stands out as the leading factor in end-stage renal disease (ESRD), and diabetic kidney disease (DKD) remains prevalent in both types of diabetes [6]. ESRD is experienced by roughly 50% of DN patients, and there is also a noticeable increase in the death rate of patients with DN. Changes in ultrastructure and diabetic kidney dysfunction, including proteinuria, glomerulomegaly, a decreased glomerular filtration rate, renal fibrosis, and kidney failure, are the primary pathological signs of DN [7]. The two main clinical pathological signs of diabetic kidney disease (DN) are albuminuria and renal fibrosis. Diabetic glomerulosclerosis is the main histological characteristic of traditional diabetic nephropathy. The glomerular basement membrane is increased in size. The mesangial matrix is accumulated. Additionally, the foot process of the podocyte is effaced. The mechanisms behind the onset and progression of diabetic nephropathy (DN) are multifaceted and include oxidative stress, inflammation, podocyte injury, vascular endothelial dysfunction, glomerular insulin resistance, and disorders of glucose and lipid metabolism [8]. Proteinuria, also known as albuminuria, is a crucial indicator of how CKD may progress [9]. Numerous people continue to develop ESRD even though pharmacological measures can stop the course of DN. The DN still has a significant negative social and economic impact on society. The little knowledge of its pathogenesis has hindered efforts to regulate and cure DN. This highlights the need to research the biology of DN treatment strategies for successful prevention. A fibroblast growth factor (FGF) protein group shares a similar structural makeup. It regulates various biological and pathological processes through the paracrine or endocrine system, including wound healing, embryonic development, angiogenesis, and metabolism [10]. Studies have recently concentrated on determining the mechanism underlying the connection between FGF and the challenges associated with diabetes. Typically, hypoglycemic drugs are used to treat diabetes mellitus (DM). However, these drugs might have serious side effects like hypoglycemia. The FGF cannot cause hypoglycemia, making it a safe therapeutic option for treating diabetes. According to certain studies, FGF can improve oxidative stress, lipid metabolism, inflammation, and insulin resistance. These factors are essential for developing diabetes and its related problems; it is necessary to confirm the underlying mechanism of this association [11-14]. There is mounting evidence that DN development is fundamentally influenced by glomerular and tubulointerstitial inflammation. Expressing adhesion molecules and chemokines is frequently accompanied by tissue injury, leading to macrophage infiltration into renal tissues [15]. The main objective of this study is to evaluate the level of FGF in the serum of DN patients and comparison of the results with the control group.
Methods![]()
This case-control study was carried out on patients in the Telafer Hospital from April 2021 to June 2022. The subjects in this study were 135 participants: 90 (53 males and 37 females) and 45 controls. The current study included 90 type 2 DM patients classified into three groups depending on their urine albuminuria levels. These three groups include 45 diabetic patients with normal albuminuria, 22 patients with macroalbuminuria, and 23 patients with microalbuminuria. Out of 135 participants, 45 were healthy persons, named as the control group. A consulting nephrologist performed a clinical examination of all individuals. This kit uses a dual-antibody biotin sandwich-based enzyme-linked immunosorbent assay (ELISA)
Statistical analysis
Statistical analyses were performed using the Statistical Package for the Social Sciences (SPSS), version 17.0 for Windows (SPSS Inc., Chicago, IL, USA). Continuous/quantitative variables were described with means and standard deviations, while categorical/qualitative variables were described with numbers and percentages.
Results![]()
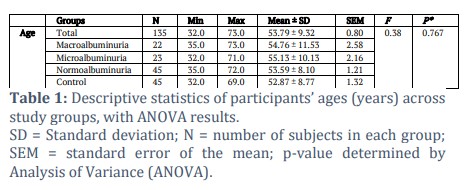
The age means ranged from 54.76 ± 11.53 to 55.13 ± 10.13 for macroalbuminuria and microalbuminuria, respectively, while the age for the Normoalbuminuria group was 53.59 ± 8.10. For control, it was 52.87 ± 8.77. The variation in age among the groups was not significant, as indicated by the ANOVA statistic, F (3, 131) = 0.38, p = 0.767 (Table 1).
SD = Standard deviation; N = number of subjects in each group; SEM = standard error of the mean; p-value determined by Analysis of Variance (ANOVA).
Body mass index (BMI)
For Macroalbuminuria, BMI had an average of 25.97 ± 1.90. For Microalbuminuria, BMI had an average of 24.92 ± 2.57. For Normoalbuminuria, BMI had an average of 25.57 ± 2.33. For Control, BMI had an average of 23.00 ± 1.95. The ANOVA results were significant, F (3, 131) = 13.86, p < 0.001, indicating that there were significant differences in BMI among the groups. Multiple pairwise comparisons reveal that BMI for Macroalbuminuria, Microalbuminuria, and Normoalbuminuria were significantly larger than in control, p < 0.001, p = 0.005, and p < 0.001, respectively (Table 2). No other significant effects were found.
Fasting Blood Sugar (FBS)
For Macroalbuminuria, FBS had an average of 248.29 ± 78.98. For Microalbuminuria, FBS had an average of 280.65 ± 115.74. For Normoalbuminuria, FBS had an average of 186.39 ± 79.25. For Control, FBS had an average of 97.67 ± 6.02 (Table 2). The ANOVA results were significant, F (3, 131) = 39.53, p < 0.001, indicating that there were significant differences in FBS among the groups. It means that FBS for Macroalbuminuria (M = 248.29 ± 78.98) was significantly larger than for Normoalbuminuria (M = 186.39 ± 79.25), p = 0.009. And, the mean of FBS for Macroalbuminuria (M = 248.29 ± 78.98) was significantly larger than for Control (M = 97.67 ± 6.02), p < 0.001. And, the mean of FBS for Microalbuminuria (M = 280.65 ± 115.74) was significantly larger than for Normoalbuminuria (M = 186.39 ± 79.25), p < 0.001. And, the mean of FBS for Microalbuminuria (M = 280.65 ± 115.74) was significantly larger than for Control (M = 97.67 ± 6.02), p < 0.001. And, the mean of FBS for Normoalbuminuria (M = 186.39 ± 79.25) was significantly larger than for Control (M = 97.67 ± 6.02), p < 0.001.
HbA1c
The average HbA1c of the macroalbuminuria group was 10.49 ± 2.70. The average HbA1c level of microalbuminuria group was 10.43 ± 2.37. The average HbA1c levels for Normoalbuminuria and Control were 8.49 ± 1.87 and 5.06 ± 0.21, respectively (Table 2). The ANOVA results were significant: F (3, 131) = 67.83, p < 0.001. This means that at least one group had HbA1c levels that were very different from the other groups. Multiple pairwise comparisons were done, and the results showed that the mean HbA1c for Macroalbuminuria (M = 10.49 ± 2.70) was significantly higher than for Normoalbuminuria p < 0.001 and Control p < 0.001. On the other hand, the mean HbA1c for Microalbuminuria (M = 10.43 ± 2.37) was significantly higher than for both Normoalbuminuria (p < 0.001) and Control (p < 0.001). Lastly, the mean HbA1c for Normoalbuminuria (M = 8.49 ± 1.87) was significantly higher than the mean HbA1c for Control (M = 5.06 ± 0.21).
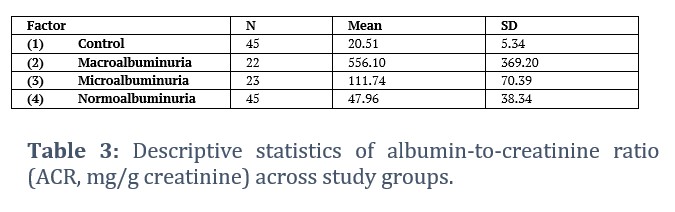
Albumin-to-Creatinine Ratio (ACR)
For Macroalbuminuria, ACR had an average of 556.10 ± 369.20. For Microalbuminuria, ACR had an average of 111.74 ± 70.39. For Normoalbuminuria, ACR had an average of 47.96 ± 38.34. For Control, ACR had an average of 20.51 ± 5.34 (Table 3). The ANOVA results were significant, F (3, 131) = 70.25, p < 0.001, indicating that there were significant differences in ACR among the groups. This mean value is higher than the stated cutoff for normoalbuminuria (ACR < 30 mg/g), indicating a discrepancy between the group definition and the observed data. The results of multiple pairwise comparisons showed that the mean of the ACR for macroalbuminuria (556.10 ± 369.20) was significantly larger than for microalbuminuria (111.74 ± 70.39), p < 0.001; it was also significantly larger than for normoalbuminuria (M = 47.96 ± 38.34), p < 0.001; and it was also significantly larger than for control (p < 0.001).
The mean ACR in the normal-to-borderline albuminuria group was slightly above the classical normoalbuminuria threshold (< 30 mg/g). This reflects the inclusion of patients with transient or borderline albuminuria, consistent with physiological variability in urinary albumin excretion. This classification was maintained to preserve group comparability and reflect real-world diabetic nephropathy presentation.
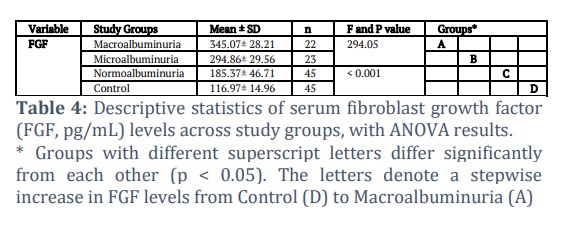
Fibroblast Growth Factor (FGF)
For Macroalbuminuria, FGF had an average of 345.07 ± 28.21; for Microalbuminuria, FGF had an average of 294.86 ± 29.56; for Normoalbuminuria, FGF had an average of 185.37 ± 46.71; for Control, FGF had an average of 116.97 ± 14.96 (Table 4). According to the ANOVA results, F (3, 131) = 294.05, p < 0.001, there were significant differences in FGF between groups. Multiple pairwise comparisons were made to see individual group differences as compared to Microalbuminuria (M = 294.86 ± 29.56), Normoalbuminuria (M = 185.37 ± 46.71), and Control (M = 116.97 ± 14.96). Macroalbuminuria's FGF mean had a significantly higher value (M = 345.07 ± 28.21), p < 0.001. Compared to normoalbuminuria and control, the mean of FGF for Microalbuminuria was significantly higher, p < 0.001. Normoalbuminuria's FGF mean value was also significantly higher than Control (M = 116.97 ± 14.96), with a p-value of less than 0.001.
Figures & Tables

Diabetic nephropathy (DN) is a chronic microvascular complication caused by long-term hyperglycemia in patients with diabetes and is an important cause of end-stage renal disease [16-17]. Detecting diabetes nephropathy (DN) early and acting quickly to prevent and treat it is crucial. In some cases, the presence of albuminuria or the ratio of albumin to creatinine (ACR) functions as a sign of early detection for DN, although some research has highlighted its drawbacks, such as discrepancies with chronic kidney disease (CKD) stages, in certain individuals [6]. FGF also participates in the differentiation and apoptosis of numerous cells, their growth and development, and protects tissues against fibrosis [18-20]. The resulting albuminuria concentration can be expressed as albumin-to-creatinine ratio. This ratio will be used for comparison of the quantity of albumin against the level of creatinine in urine samples to compensate for the variation of creatinine concentration in urine [21-23]. An analysis of variance (ANOVA) revealed no statistically significant difference in the ages of the groups compared to the control groups, with which the findings of Sueud et al. (2019) concur [24]. It was shown that there was no significant difference in the mean age of the two types of diabetes with diabetic nephropathy. Multiple pairwise comparisons reveal that BMI for Macroalbuminuria, Microalbuminuria, and Normoalbuminuria were significantly larger than in Control, p < 0.001, p = 0.005, and p < 0.001. No other significant effects were found, which is consistent with the study of Maric-Bilkan et al., [25]. The results of the study confirmed that BMI was significantly higher in patient groups than in the healthy control group. This finding was in agreement with Komatsu et al., [26]. The findings of this investigation were supported by numerous studies. Al-Bayati et al., [27] reported that the diabetes group’s mean FGF was considerably greater than that of the control group. There was only a significant difference in mean FGF between the diabetic groups with respect to the level of glycaemia [28]. It was reported that there were significant differences in the mean HbA1c levels between the diabetics and the controls, and that within the diabetes groups, there were significant differences between normal and microalbuminuria, as well as highly significant differences between macroalbuminuria and both normal and microalbuminuria. One major risk factor for the development and progression of diabetic nephropathy is inadequate glycemic management. High HbA1c levels in T2D patients are associated with an increased risk of developing nephropathy, severe albuminuria, or end-stage kidney disease (ESKD) [29]. There were significant differences in ACR among the groups. The current study’s result showed that the ACR ratio was substantially higher in DN participants than in healthy subjects. This conclusion is corroborated by a recent study that included 90 DM subjects and concluded that the ACR value was a good, sensitive, and specific diagnostic marker of DN [30]. The outcomes also agree with research by Siddiqui et al., [29] that an elevated ACR score was a universal indicator of renal impairment. As a result, there were significant differences in FGF between the groups. The primary findings of the current investigation demonstrate that patients with DN had elevated serum levels of FGF, which is in agreement with Ornitz et al., [31] and makes FGF an important biomarker of DN.
This study showed the relationship between FGF levels and DN. The FGF level was significantly higher in the stages of DN, indicating that FGFs and ACR might be promising biomarkers of DN.
Limitations
Although the study design and statistical analyses were appropriate, the unequal sample sizes across groups (45 normoalbuminuria, 23 microalbuminuria, 22 macroalbuminuria, and 45 controls) may have modestly affected the statistical power and homogeneity of variance. Nonetheless, the ANOVA test is generally robust to such differences, and the consistency of observed trends across all diabetic subgroups supports the reliability of the findings.
Author Contributions
All authors of the article contributed equally.
The authors declare no conflict of interest in the publication of this manuscript.![]()
References
- Zhang H, Nie X, Shi X, Zhao J, Chen Y, et al. Regulatory mechanisms of the Wnt/β-catenin pathway in diabetic cutaneous ulcers. Frontiers in pharmacology, (2018); 9(2018): 1114.
- Gnudi L, Coward RJ, Long DA. Diabetic nephropathy: perspective on novel molecular mechanisms. Trends in Endocrinology & Metabolism, (2016); 27(11): 820-830.
- Sadiq CH, Hussein R H, Maulood I M. Ghrelin and leptin and their relations with insulin resistance in diabetes mellitus type 2 patients. Baghdad Science Journal, (2022); 19(1): 0033-0033.
- Fadhel AA, Al-Tameemi M, Alfarhani BF. Biochemical Investigation in Blood Serum of Female Patients in Type-2 Diabetes. Journal of Global Pharma Technology, (2018); 10(10): 369-373.
- Ali KA, Al-Kirwi EN, W-Shaban SA. Relation between Serum Leptin, Lipid Profiles and other biomarkers levels in patients with type 2 diabetic nephropathy. Baghdad Science Journal, (2010); 7(1): 678–686.
- Tuttle KR, Bakris GL, Bilous RW, Chiang JL, De Boer IH, et al. Diabetic kidney disease: a report from an ADA Consensus Conference. Diabetes care, 2014; 37(10): 2864-2883.
- Bhattacharjee N, Barma S, Konwar N, Dewanjee S, Manna P. Mechanistic insight of diabetic nephropathy and its pharmacotherapeutic targets: an update. European journal of pharmacology, (2016); 791(2016): 8-24.
- Deng J, Liu Y, Liu Y, Li W, Nie X. The Multiple Roles of Fibroblast Growth Factor in Diabetic Nephropathy. Journal of inflammation research, (2021); 14(2021): 5273-5290.
- Hassan EA, Khaleel FM. Serum Vitronectin and Related Molecules in Chronic Kidney Disease. Medico-legal Update, (2020); 20(2): 339.
- Zhang X, Yeung DC, Karpisek M, Stejskal D, Zhou ZG, et al. Serum FGF21 levels are increased in obesity and are independently associated with the metabolic syndrome in humans. Diabetes, (2008); 57(5): 1246-1253.
- Li X, Wu D, Tian Y. Fibroblast growth factor 19 protects the heart from oxidative stress-induced diabetic cardiomyopathy via activation of AMPK/Nrf2/HO-1 pathway. Biochemical and Biophysical Research Communications, (2018); 502(1): 62-68.
- Vickers NJ. Animal communication: When I’m calling you, will you answer too?. Current biology, (2017); 27(14): R713-R715.
- Cho JM, Yang EH, Quan W, Nam EH, Cheon HG. Discovery of a novel fibroblast activation protein (FAP) inhibitor, BR103354, with anti-diabetic and anti-steatotic effects. Scientific Reports, (2020); 10(1): 21280.
- Wada J, Makino H. Inflammation and the pathogenesis of diabetic nephropathy. Clinical science, (2013); 124(3): 139-152.
- Luis-Rodríguez D, Martínez-Castelao A, Górriz JL, De-Álvaro F, Navarro-González JF. Pathophysiological role and therapeutic implications of inflammation in diabetic nephropathy. World journal of diabetes, (2012); 3(1): 7-18.
- Rivero A, Mora C, Muros M, García J, Herrera H, et al. Pathogenic perspectives for the role of inflammation in diabetic nephropathy. Clinical science, (2009); 116(6): 479-492.
- Sagoo, Manpreet K., and Luigi G. Diabetic nephropathy: an overview: Diabetic nephropathy: methods and protocols. (2020); 2067: 3-7. Springer Nature
- House SL, Branch K, Newman G, Doetschman T, Schultz Jel J. Cardioprotection induced by cardiac-specific overexpression of fibroblast growth factor-2 is mediated by the MAPK cascade. Am J Physiol Heart Circ Physiol, 2005; 289(5): H2167-H2175.
- Braun S, Auf Dem Keller U, Steiling H, Werner S, Brockes JP, et al. Fibroblast growth factors in epithelial repair and cytoprotection. Philosophical Transactions of the Royal Society of London B, (2004); 359 (1445): 753-757.
- Gupte VV, Ramasamy SK, Reddy R, et al. Overexpression of fibroblast growth factor-10 during both inflammatory and fibrotic phases attenuates bleomycin-induced pulmonary fibrosis in mice. American journal of respiratory and critical care medicine, (2009); 180(5): 424-436.
- Gross JL, De Azevedo MJ, Silveiro SP, Canani LH, Caramori ML, Zelmanovitz T. Diabetic nephropathy: diagnosis, prevention, and treatment. Diabetes care, (2005); 28(1): 164-176.
- Caramori ML, Fioretto P, Mauer M. The need for early predictors of diabetic nephropathy risk: is albumin excretion rate sufficient? Diabetes, (2000); 49(9): 1399-408.
- Bakker AJ. Detection of microalbuminuria: Receiver operating characteristic curve analysis favors albumin-to-creatinine ratio over albumin concentration. Diabetes care, (1999); 22(2): 307-313.
- Sueud T, Hadi NR, Abdulameer R, Jamil DA, Al-Aubaidy HA. Assessing urinary levels of IL-18, NGAL and albumin creatinine ratio in patients with diabetic nephropathy. Diabetes & Metabolic Syndrome: Clinical Research & Reviews, (2019); 13(1): 564-568.
- Maric-Bilkan C. Obesity and diabetic kidney disease. The Medical Clinics of North America, (2012); 97(1): 59-74.
- Komatsu T, Fujihara K, Yamada MH, Sato T, Kitazawa M, et al. 449-P: Impact of Body Mass Index (BMI) and Waist Circumference (WC) on coronary artery disease (CAD) in Japanese with and without diabetes mellitus (DM). Diabetes, (2020); 69(Supplement_1): 449-P.
- Al-Bayati AA, Al-Khateeb SM. The association between glycaemic level and lipid profile with Albuminuria in Iraqi type 2 diabetes patients – A cross sectional study. The Journal of the Pakistan Medical Association, (2021); 71(12): S57-S62.
- Deng J, Liu Y, Liu Y, Li W, Nie X. The multiple roles of fibroblast growth factor in diabetic nephropathy. Journal of inflammation research, (2021); 14(2021): 5273-5290.
- Siddiqui K, Joy SS, Nawaz SS, Alnaqeb D, Mujammami M, et al. Association of urinary non-albumin protein with the different urinary marker for glomerular and tubular damage in patients with type 2 diabetes. BMC nephrology, (2020); 21(2020): 1-9.
- Donate-Correa J, Martín-Núñez E, Ferri C, Hernández-Carballo C, Tagua VG, et al. FGF23 and klotho levels are independently associated with diabetic foot syndrome in type 2 diabetes mellitus. Journal of clinical medicine, (2019); 8(4): 448.
- Ornitz DM, Itoh N. The Fibroblast Growth Factor signaling pathway. Wiley Interdisciplinary Reviews: Developmental Biology, (2015); 4(3): 215-266.
This work is licensed under a Creative Commons Attribution-Non Commercial 4.0 International License. To read the copy of this license please visit: https://creativecommons.org/licenses/by-nc/4.0