

Meta Data Analysis
Last Decade of Dengue – and the Next one
Shafique Ahmed1§, Tayyaba Ijaz2, Muti-ur-Rehman Khan3, Saima Masood3, Saadia Ijaz2, Muhammad Younus3, Zahid Pervaiz4, Tahir Yaqub5
Adv. life sci., vol. 1, no. 1, pp. 3-12, November 2013
§-Corresponding Author: Shafique Ahmed (Email: shafiq.cemb@gmail.com)
Author Affiliations
2-Mayo Hospital, King Edward Medical University, Lahore- Pakistan
3-Department of Pathology, University of Veterinary and Animal Sciences, Lahore- Pakistan
4-Chairman, Mayo Hospital Research Cell, Lahore- Pakistan
5-Director, Institute of Biochemistry and Biotechnology, University of Veterinary and Animal Sciences, Lahore – Pakistan
Abstract
Introduction
Methods
Results
References
Abstract
Background: Before 1970, only 9 countries had dengue. Until 1998, there were 1.2 billion dengue infected cases in 56 different countries around the globe. To date it is prevalent in all of 6 WHO regions. Mortality rate is thought to be 2.5% as it varies from country to country. These figures are not surely depicting exact situation as many cases from most parts of the underdeveloped and developing countries go unreported due to number of reasons but one thing is sure that it is on accelerating note.
Methodology: In this study, total number of dengue victims around the globe from year 2000-2009 was estimated. Data were collected from World Health Organization (WHO), different health and country specific emergency dealing agenciesand hospitals. We have shown dengue statistics in annotated maps of international regions where dengue has affected in certain. In a country specific (Pakistan) study we have determined most vulnerable population group among society, their age, gender and immunological profile against dengue virus. Moreover, most prevalent serotype of dengue virus is determined by surveying the current data.
Results: It is estimated that there were 24,956 lives lost world wide during 2000-2009 as a consequence of dengue infection (DF/DHF/DSS) with an average CFR of 0.24%. These figures are approximate as we have not included the unauthentic source figures from non-reporting (to WHO) countries or not having an official database. A total of 10,178,624 clinical cases had been reported during that period with highest share of Americas of 6,586,785 cases.
Conclusion: Our estimate suggests that number of dengue cases got elevated in first decade of 21st century but death rate is not that higher as 2-2.5% which is estimated. Dengue is spreading and finding novel places as temperature and travelling is getting increased.
Keywords: Dengue infection, Epidemeological modelling, Europe, Asia, Meta-analysis
Introduction
First decade of 21st century has witnessed a lot of deadly disasters from 9/11 to tsunami and earth quakes. It also brought magnified dengue. Dengue fever is not new to this world. AB Rush, for the first time in 1779, noticed it as of a different kind of fever in Philadelphia and called it “bilious remitting fever” [1] but theory exists that this is even older than 1780s. Dengue does not have contagious history. It erupts as an endemic after every 4-5 years to be approximate. 1907 has proved the landmark year when dengue was declared as the second most prevalent viral disease [2] and 1998 was the D-year (dengue year) for Philippines when it witnessed dengue as epidemic claiming over 500 deaths first time in history [3]. Globally, 1998 was the most effective year of 20th century with 1,300,000 cases recorded in just three WHO health regions South East Asia, Western Pacific and Americas followed by 1997 with 850,000 cases [1]. It was declared endemic in 112 countries by the end of 2004 [4]. Death and disease counts associated with first decade of 21st century vary greatly from country to country. Mortality rate ranges from 0.5-3.5% for effected Asian countries [5]. Disease prevalence depends upon the climate, expansion of both vector and victim, travelling and migration [6], sanitation facilities of the areas, public awareness, medical facilities and the precautionary measure taken against dengue vector by people or governments on domestic and regional level [7]. These all factors control the amplification of dengue. Aedesaegypti and Aedes albopictus are the primary and secondary vectors for dengue respectively. A.aegypti is highly domesticated and adaptive insect [8]. Hot and humid weather conditions favor the survival and reproduction of A. aegypti, that is why affected regions includes tropics, sub-tropics, Americas, Southeast Asia, South Asia, Eastern Mediterranean, Pacific and Africa [9]. Among half world of the susceptible population [10], 975 million of vulnerable people live in urban areas of tropics and subtropics [8]. Amazingly, A. albopictus is ranked 4th in top 100 invasive species [11] [http://www.issg.org/database/species/search.asp?st=100ss&fr=1&str=&lang=EN]. This makes dengue even more prevalent. A glimpse of dengue situation and increasing trend from 1960 to
-

- Figure 1
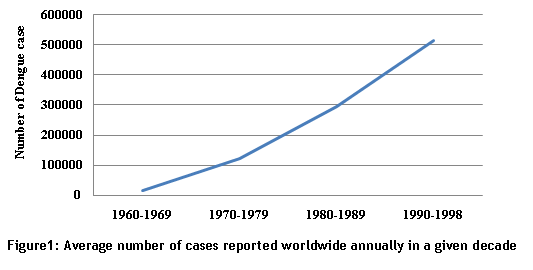
1998 is given in figure 1 (World Health Organization. Prevention and control of dengue and dengue hemorrhagic fever: comprehensive guidelines: WHO Regional publication, SEARO, No 29 1999.
As our globe is warming up so A. albopictus is extending its sting to newer places. France is an effective example in Europe [11][12]. Cases has started showing up in Germany, Belgium, Sweden and United Kingdom [13]. Some developing countries, like Pakistan and Senegal has faced severe epidemic during the 2006-2010 but no data have been submitted to WHO or any other international surveillance group [14]. This makes it a challenging task to estimate the total suffered humanity and lives lost in fighting against dengue. Underreporting is also a serious issue. According to one estimate under-reporting in Cambodia and Thailand is 1.4-9.6 times than the original cases. Besides this, severity, timing and level of dengue varies with countries and regions. Dengue cases showed region-specific peaks for South America (March), Southeast Asia (June, September), South Central Asia (October) and the Caribbean (August, October)[15]. For this, to calculate the exact morbidity and mortality rate we collected data from different global hot spots of the dengue. Designing future frame work, health budget allocation and prevention
strategies including development of direct therapies are majorly depending on determination of exact effected world’s population.
Methods
To calculate the total infected population for last decade 2000-2009, we took data from different sources. DengueNet, a service provided by WHO for international dengue surveillance, is used to get empirical data of 82 WHO member countries [16]. Seventy-three (of 82) countries have not submitted their regional data for the period of 2006-2009 to central DengueNet of WHO. For the non-reporting period, we collected data from Centre for Arbovirus Reference & Research (Dengue/Dengue Haemorrhagic Fever) Malaysia, Centre for Ecology, Taxonomy and Control of Vectors of Malaria, Filariasis and Dengue Malaysia, Centre for Dengue and Dengue Hemorrhagic Fever Reference and Research, Puerto Rico, Centre for Case Management of Dengue Fever (DF), Thailand, Centre for Insecticide Resistance and Insecticide Research on Chagas and Dengue Vectors, Argentina, Centre for the Study and Control of Dengue, Cuba, Pan American Health Organization (PAHO), United States of America and European Network for Imported Viral Disease (ENVID-CLRN). For 2010-2012 Google Dengue Trends is used as reference for these countries: Brazil, Argentina and India. To present the exact epidemiological picture of other potential hot-spot countries for the given decade we collected data through different resources like health departments, emergency dealing agencies and news reports. These countries include Pakistan, Senegal and Saudi Arabia. News reports may not be completely reliable but do provide the sense of situation. Pakistan has faced strong endemic in 2006, 2010 and 2011 but not even the name of this country, among other endemic struck countries in WHO list, is mentioned. This could be because of unavailability of data, international loneliness or country’s other hyper issues. To judge situation for Pakistan, we have done a model serological survey in 2011 at the time of high epidemic from Oct to Dec 2011 on central public hospital.
Results
Estimation of Effected Human Population Worldwide:
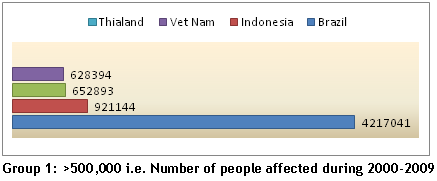
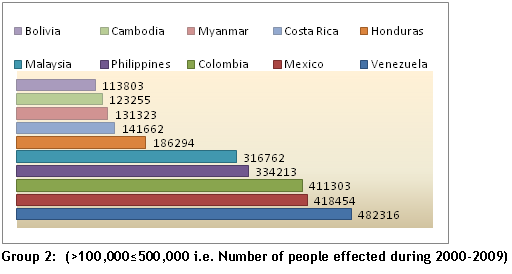
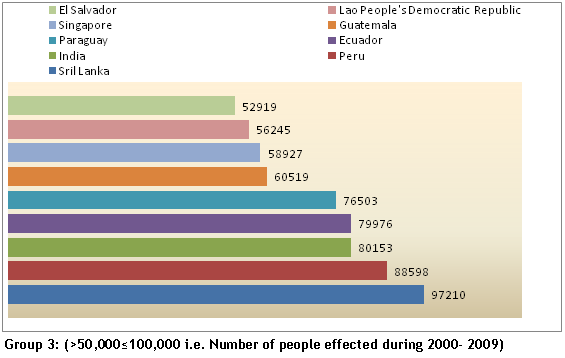
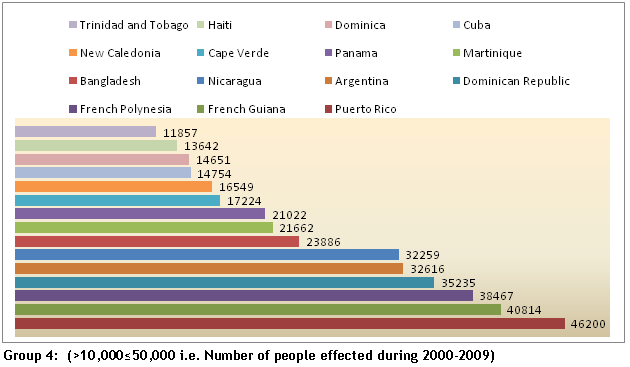
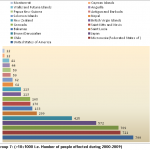
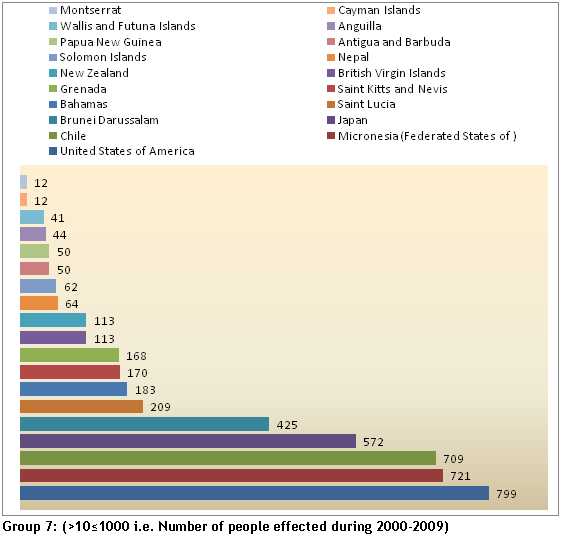
According to our estimate, during 2000-2009, a total of approximately 10,178,624 people in 79 countries had dengue infection in any of its three forms. This data could have small variation because there are difference between data of the regional offices and central offices of WHO. Where there is difference, we relied on central office/DengueNet data. Countries are divided into 7 groups according to number of effected people. First group includes nations with above 500,000 dengue patient per-decade (2000-2009). Brazil stood first, as often [17], among 4 countries of the first group with 2,047,270 dengue victim. 3 out of 4 countries (Indonesia, Thailand and Viet Nam) from first group represent Southeast Asia. Details of other seven groups are given in figures below.
Groups (1-7)
-
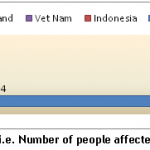
- Group 1
-
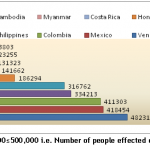
- Group 2
-
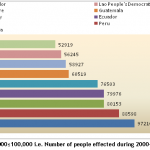
- Group 3
-
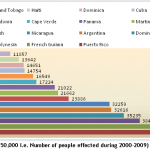
- Group 4
-
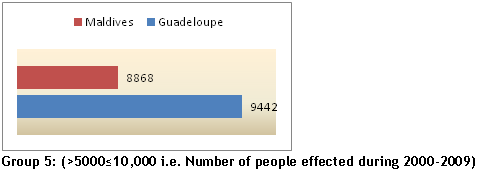
- Group 5
-
- Group 6
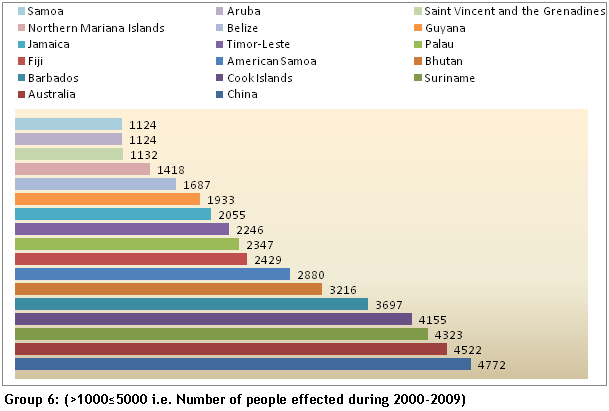
-
- Group 7
Africa is potential reservoir and importer of Dengue cases [13,18]. But most of the cases till now have gone unreported due to lack of clinical and serological surveillance. Numbers of people returning home after visiting Africa are detected dengue positive. So, an indirect realization of the dengue affecting countries has been made. This has flagged South Africa as leading country followed by Senegal, Burkina Faso and Guinea [19]. Other countries in which dengue cases were reported include Mali, Gabon, Cote d I’voire and Saudi Arabia during 2006-2009. But as news reports are the only source of data, so we have not included these numbers in calculation of total number of patients around the planet.In Mexico, Nicaragua, Venezuela, Colombia and Honduras most of the fatal cases occur among children <15 years of age [20,21].
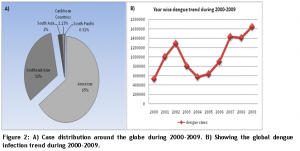
Case distribution at Hot Spot dengue regions of the world:
There are 5 hot spot regions of the world according to dengue prevalence during 2000-2009. We found 82 countries in these regions where dengue have its significant epidemic. These regions include Americas, Southeast Asia, Southern and Eastern Caribbean’s countries and south Pacific countries. Distribution of cases is as under in percentage in figure 2:
-
- Figure 2

Cases from Pakistan:
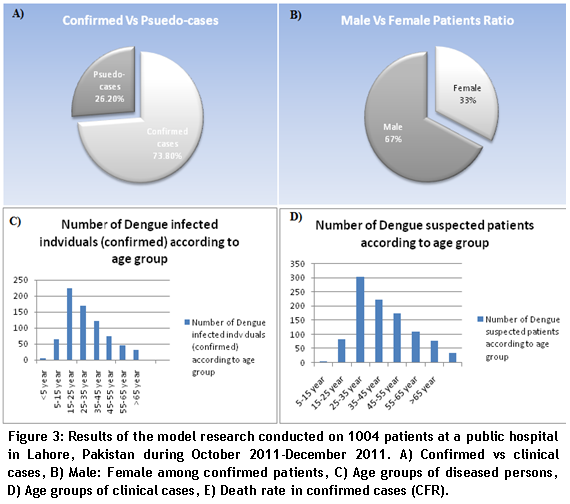
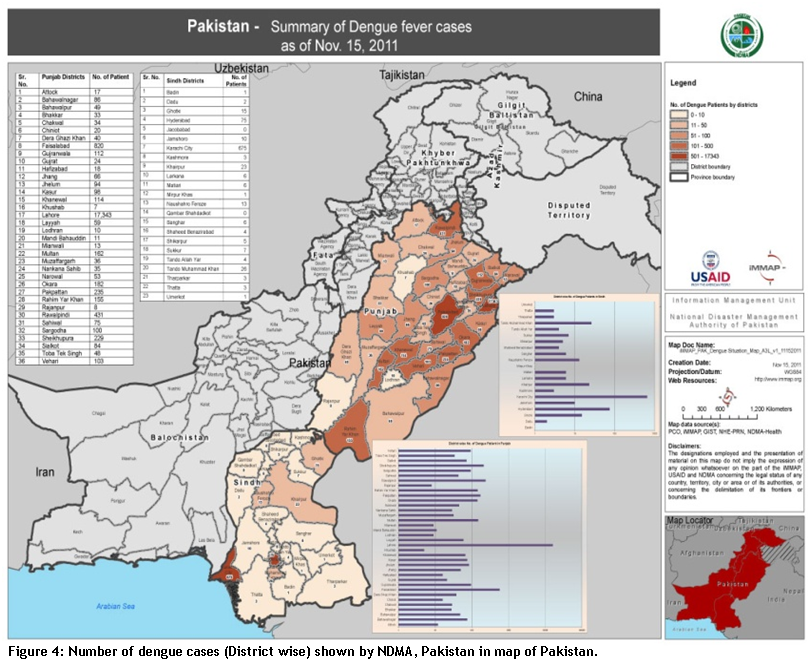
Neither WHO nor any other source has shown exact data of 2011 epidemic in Pakistan. Approximately134,061 patients presented themselves for dengue diagnosis only at one hospital in Lahore city of Pakistan. 7415 patients, among total presented cases, found ELISA positive for dengue. A model research was conducted on 1004 patients presenting signs and symptoms of typical dengue illness. All patients were screened through standard ELISA kit diagnostic automation (ISO certified) 1-4 for the confirmation of dengue virus [for all the 4 serotypes]. Examined sera were paired i.e. sera taken at the time of admission and sera taken after 10 days interval. Titer of IgG and IgM was set as conclusive for declaring patients positive or negative. Titer greater than 0.8 ± 0.2 for IgG or IgM was optimized as standard for positive patients. Positive and negative controls were maintained for test quality control. Among those 1004 suspected individuals, 741 (73.80%) were found positive for dengue virus while 263 (26.20%) were negative. 241 (33%) were representing female gender while 500 (67%) were male patients. IgG and IgM ELISA pattern was different from each other. Patients showing reaction to IgG were 483 while to IgM there were 463. 205 (27.67%) patients had shown reaction against both IgG and IgM antibodies. Age pattern of the patients was a bit out of the reported trend. Children of age 5 year or less were the least affected population i.e. 5/741 (0.67%). Most affected individual found were of the age 15-25 years i.e. 225/741 (30.36%). Rest of the patients were grouped on the age basis as: >5≤15=65 (8.77%), >25≤35=170 (22.94%), >35≤45=121 (16.33%), >45≤55=73 (9.85%), >55≤65=46 (6.20%) and >65=31 (4.18%). Same trend in the age groups were observed in all 1004 dengue suspected cases (fig 2). 19 patients could not survive the infection (mortality rate 2.56%). All of these patients belonged to Lahore city. Pakistan’s other cities where endemic showed up like Karachi and Faisalabad had almost same situation and trends but at less magnitude. Although National Disaster Management Authority (NDMA), Pakistan has issued a country map showing number of patient district wise for 2011 epidemic Fig 3. But this map is not a true picture as this just represents cases of two provinces Punjab and Sindh.
-

- Figure 3
-

- Figure 4
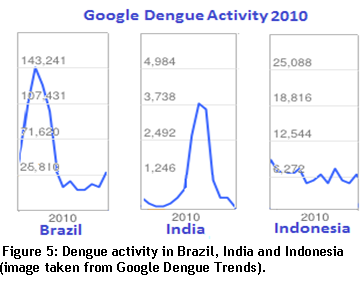
Google Dengue Trends:
We consulted Google Dengue Trends (GDT) to give glimpse of dengue in three countries (Brazil, Indonesia and India) having a major dengue burden around the world.
-

- Figure 5
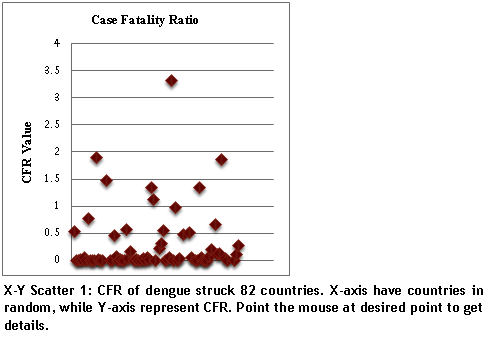
Case Fatality Ration (CFR):
We have calculated Case Fatality Ratio on different parameters than WHO. As WHO figures do not depict the original picture but exaggerate the facts. For example for 2002 in Bolivia the FCR is given as 100 which could not be set as reference because all effected patients could not die (http://apps.who.int/globalatlas/dataQuery/reportData.asp?rptType=1). We established dengue CFR on the basis of total clinical cases presented rather than just calculating on the ground of DHF cases or laboratory confirmed cases.
-

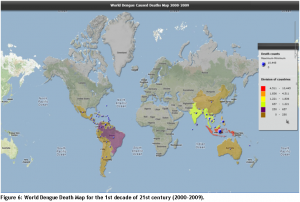
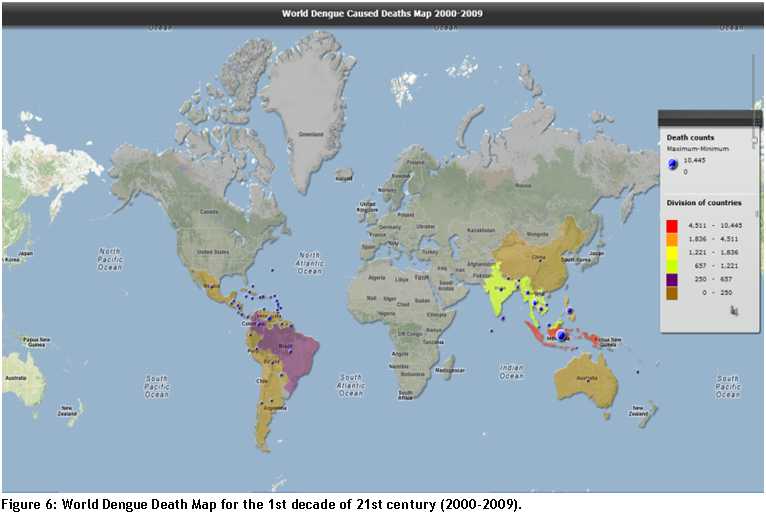
- Figure 6
According to data provided by authentic sources we estimate that a total of 24,956 lives lost during 2000-2009. This is by no means the actual deaths figure. There are number of reasons behind the low anticipated toll. After diagnosis, a major fraction of dengue patients do not or could not stay at hospital. So if it turns fatal then there is no record on hospital or any other official database. For example just in Pakistan, a page in Wikipedia claims that more than 50 people died of dengue during 2006 epidemic though don’t have any reference and neither Pakistan’s statistics have been mentioned at any other international database. But there was epidemic at a very large level and it must have had claimed lives in Pakistan for the given period so we can say that deaths are considerably high than reported numbers. Death rate/disease in Asian countries is very much less as compared to total number of appeared cases. This supports the idea that Asian and Black people are much more resistant to dengue than White people. A ratio of Asian & Caucasian vs. African in 1997 was estimated 5:1 for Cuban epidemic [22,23]. For reported cases, death map of dengue patients is given below.
-
- Figure 7
The Next Decade:
Mosquitoes’ population in Europe is increasing at significant pace. So, in ongoing decade, Europe is forecasted to be the next play ground for dengue. Italy, France, Monaco and other countries near the Mediterranean Sea are at greater risk due to presence of A. Aegypti and A. Albocatus. Economic burden is also likely to be increased. In past decade, US$238 (on average) was the cost being spent per dengue patient in 7 major dengue struck countries [24]. However expenses can be controlled if more budgets are allocated in the head of controlling measures. Vector controlling measures has successfully knocked down dengue with a significant decrease in affected population in country like Pakistan for the year 2012.
References
- Guzmán MG, Kouri G. Dengue: an update. The Lancet infectious diseases, (2002); 2(1): 33-42.
- Henchal EA, Putnak JR. The dengue viruses. Clinical microbiology reviews, (1990); 3(4): 376-396.
- Tayag EA. The dengue epidemic of 1998 in the Philippines. Dengue Bull, (1998); 2287-94.
- Malavige G, Fernando S, Fernando D, Seneviratne S. Dengue viral infections. Postgraduate medical journal, (2004); 80(948): 588.
- Halstead SB. Is there an inapparent dengue explosion? The Lancet, (1999); 353(9158): 1100-1101.
- Cummings DAT, Irizarry RA, Huang NE, Endy TP, Nisalak A, et al. Travelling waves in the occurrence of dengue haemorrhagic fever in Thailand. Nature, (2004); 427(6972): 344-347.
- Hales S, De Wet N, Maindonald J, Woodward A. Potential effect of population and climate changes on global distribution of dengue fever: an empirical model. The Lancet, (2002); 360(9336): 830-834.
- Guzman MG, Halstead SB, Artsob H, Buchy P, Farrar J, et al. Dengue: a continuing global threat. Nature Reviews Microbiology, (2010); 8S7-S16.
- Research SPf, Diseases TiT.Scientific working group report on dengue. (2007).
- Mackenzie JS, Gubler DJ, Petersen LR. Emerging flaviviruses: the spread and resurgence of Japanese encephalitis, West Nile and dengue viruses. Nature medicine, (2004); 10S98-S109.
- Caminade C, Medlock JM, Ducheyne E, McIntyre KM, Leach S, et al. Suitability of European climate for the Asian tiger mosquito Aedesalbopictus: recent trends and future scenarios. Journal of The Royal Society Interface, (2012); 9(75): 2708-2717.
- Gould E, Gallian P, De Lamballerie X, Charrel R. First cases of autochthonous dengue fever and chikungunya fever in France: from bad dream to reality! Clinical microbiology and infection, (2010); 16(12): 1702-1704.
- Jelinek T. Trends in the epidemiology of dengue fever and their relevance for importation to Europe. Euro Surveillance, (2009); 1425.
- Gubler DJ. The changing epidemiology of yellow fever and dengue, 1900 to 2003: full circle? Comparative immunology, microbiology and infectious diseases, (2004); 27(5): 319-330.
- Schwartz E, Weld LH, Wilder-Smith A, Von Sonnenburg F, Keystone JS, et al. Seasonality, annual trends, and characteristics of dengue among ill returned travelers, 1997–2006. Emerging Infectious Diseases, (2008); 14(7): 1081.
- Organization WH. DengueNet–WHOs internet-based system for the global surveillance of dengue fever and dengue haemorrhagic fever. Weekly Epidemiological Record, (2002); 77(36): 300-304.
- Teixeira MG, Maria da Conceição NC, Barreto F, Barreto ML. Dengue: twenty-five years since reemergence in Brazil Dengue: vinte e cincoanos da reemergência no Brasil. Cad saúdepública, (2009); 25(Sup 1): S7-S18.
- Jelinek T, Mühlberger N, Harms G, Corachan M, Grobusch M, et al. Epidemiology and clinical features of imported dengue fever in Europe: sentinel surveillance data from TropNetEurop. Clinical infectious diseases, (2002); 35(9): 1047-1052.
- Franco L, Di Caro A, Carletti F, Vapalahti O, Renaudat C, et al. Recent expansion of dengue virus serotype 3 in West Africa. Euro Surveillance, (2010); 15(7).
- Hammond SN, Balmaseda A, Pérez L, Tellez Y, Saborío SI, et al. Differences in dengue severity in infants, children, and adults in a 3-year hospital-based study in Nicaragua. American Journal of Tropical Medical and Hygiene, (2005); 73(6): 1063-1070.
- Balmaseda A, Hammond SN, Tellez Y, Imhoff L, Rodriguez Y, et al. High seroprevalence of antibodies against dengue virus in a prospective study of schoolchildren in Managua, Nicaragua. Tropical Medicine & International Health, (2006); 11(6): 935-942.
- Guzmán MG, Kouri GP, Bravo J, Soler M, Vazquez S, et al. Dengue hemorrhagic fever in Cuba, 1981: a retrospective seroepidemiologic study. American Journal of Tropical Medicine and Hygiene, (1990); 42(2): 179.
- Halstead SB, Streit TG, Lafontant JG, Putvatana R, Russell K, et al. Haiti: absence of dengue hemorrhagic fever despite hyperendemic dengue virus transmission. American Journal of Tropical Medicine and Hygiene, (2001); 65(3): 180-183.
- Suaya JA, Shepard DS, Siqueira JB, Martelli CT, Lum LCS, et al. Cost of dengue cases in eight countries in the Americas and Asia: a prospective study. American Journalof Tropical Medicine and Hygiene, (2009); 80(5): 846-855.