
Full Length Research Article
Association of sleep quality with body fat mass and metabolic factors in Iranian adults in 2020
Mazyar Haghgoo1, Hakimeh sadeghzadeh1, Atoosa Saidpour1, Samira Rabiei2*
Adv. life sci., vol. 10, no. 1, pp. 31-37, March 2023
*- Corresponding Author: Samira Rabiei (Email: samirarabiei@yahoo.com)
Authors' Affiliations
2. Department of Nutrition Research, National Nutrition and Food Technology Research Institute and Faculty of Nutrition Sciences and Food Technology, SBMU, Tehran – Iran
Abstract![]()
Introduction
Methods
Results
Discussion
References
Abstract
Background: Poor sleep quality is increasingly recognized as a risk factor for poor health outcomes such as obesity, diabetes and cardiovascular diseases. This study aimed to investigate the association between sleep quality, obesity and glycemic and lipid profiles in Iranian adults in 2020.
Methods: Of 353 adults aged 18–60 years enrolled from community centers in Tehran municipality, after exclusions 326 participants remained for analysis in this cross-sectional study using convenience sampling. Information on anthropometric measurements, physical activity and dietary intake were collected. Sleep quality was assessed through Pittsburgh Sleep Quality Index. Body composition was measured through BIA method. Auto analyzer was used to measure Fasting Blood Sugar (FBS) and lipid profile, and Insulin was measured using the ELISA method.
Results: The mean age was 42.92±11.34 and 39.16±14.18 for women and men, respectively. Each one-point increase in the PSQI total score was associated with a 0.1 cm increase in waist circumference and a 0.3% increase in body-fat percentage (P < 0.05). BMI had a positive correlation with subscales of ‘sleep disturbances’ and ‘use of sleep medications’ (P <0.001). Physical activity had a significant negative correlation with subscales of “subjective sleep quality” and “sleep latency”. FBS and triglyceride had positive correlation with “sleep latency” and “Subjective sleep quality”, respectively (P <0.05).
Conclusion: Some determinants of sleep quality are associated with obesity, disorders of glucose and triglyceride metabolism and low level of physical activity.
Keywords: Sleep quality; PSQI questionnaire; Body fat mass; Fasting Blood Sugar; Lipid profile
Introduction![]()
Chronic sleep deprivation due to lifestyle changes is a common problem in modern societies [1]. The prevalence of sleep disorders has been increasing over the past decades [2]. Poor sleep quality along with changes in other lifestyle habits, such as eating, physical activity, smoking and drinking, are likely of potential risk factors for non-communicable diseases such as obesity, diabetes and cardiovascular disease, [3-5]. There are some studies showing the relationship between sleep duration and glycemia [6-8] and lipid profile [9-18]. Most of these studies have suggested that short sleep duration is associated with lower high density lipoprotein cholesterol (HDL-C) and higher triglyceride (TG) level [19]. Many studies have shown that short sleep duration could also be a significant risk factor for diabetes [6,8], while there are few studies regarding sleep quality. Iyegha and colleagues showed that prediabetes is positively associated with poor sleep quality [3]. On the other hand, sleep quality is associated with appetite and dietary intake [20-22]. Poor sleep quality is also associated with severe fatigue during the day, which can reduce desire to engage in physical activities. All of the mentioned variables are associated with weight gain. Moreover, it has also been documented that physical activity can improve dyslipidemia and blood glucose intolerance [23]. Furthermore, poor sleep quality can increase stress level which in turn, may lead to increase in total and low-density lipoprotein (LDL) cholesterol and glucose serum level [10,24]. Poor sleep quality can increase cortisol secretion and muscular protein synthesis suppression [25]. It may also lead to decrease in insulin-like growth factor 1 (IGF-1) [26], increase in insulin resistance [27], increase in body fat mass [28], decrease in leptin secretion, increase in ghrelin secretion[29] and decrease in adiponectin level which can cause obesity [30]. Although it is not clear which PSQI subscales are most strongly correlated with body weight and metabolic factors. With regard to this point and considering the increasing prevalence of sleep disorders in the last decades [3] and also the lack of attention to sleep quality and its impacts on risk factors of non-communicable diseases, the current study was conducted to investigate the association between sleep quality and BMI, body fat mass, glycemic and lipid profile and physical activity level in Iranian adults, focusing on all sleep quality subsets, separately.
Methods![]()
Participants
The cross-sectional study was conducted on 353 adults, aged 18-60 years from both sexes who referred to community centers in different districts in Tehran with convenience sampling method.
Data collection
Volunteers who were not on any diet, not pregnant or lactating, and not athletes completed the PSQI questionnaire to determine their sleep quality [31]. A PSQI total score ≤5 indicates good sleep quality; scores >5 indicate poor sleep quality. To calculate BMI, weight was measured using digital scale (Beurer, Germany) to the nearest 100 grams, without shoes, while wearing light clothes. Height was measured to the nearest 0.5 cm, without shoes, using a wall-mounted, non-stretch tape measure. International Physical Activity Questionnaire (IPAQ) [32] and 3-day food recalls were completed for participants. Dietary intakes were assessed by 3-day food recalls and calorie intake was calculated by Nutritionist IV software.
Biochemical and body composition measurements
Biochemical assessments were conducted in a subsample of 90 participants. These Participants were referred to clinic of diet therapy of Shahid Beheshti University of Medical Sciences. 5 mL of blood was taken after 8 to 12 hours of fasting, and the serum samples were frozen immediately at −80°C until assay at the end of the study. Fasting blood sugar (FBS), cholesterol, TG and HDL-C level were determined by autoanalyzer, through commercial kits. Low-density lipoprotein cholesterol (LDL-c) concentration was determined by the Friedewald formula (Friedewald, Levy, & Fredrickson, 1972). Enzyme linked immunosorbent assay (ELISA) method was employed to determine Insulin Level. To assess body composition, bioelectrical impedance analysis (BIA) was used after 8-12 hours fasting in the above-mentioned clinic.
Statistical analysis
To compare anthropometric measurements, biochemical factors and physical activity level between categories of sleep quality, independent-samples t test was used. Pearson correlation was used to analyze correlation between dependent variables and all subscales of sleep quality. Relation between sleep quality and waist circumference and body fat mass was analyzed using linear regression models, before and after adjusting covariates. A two-sided P < 0.05 was considered statistically significant in all analyses.
Ethical consideration
The study was approved by the Ethics Committee of the National Nutrition and Food Technology Research Institute, Iran. The ethical code is: IR.SBMU.nnftri.Rec.1398.025.
Results![]()
A total of 353 people participated in this study. After excluding participants whose calorie intake was less than 800 or more than 4200 kcal, 326 people remained for the analysis.
Sociodemographic characteristics
Overall mean age was 41.1 ± 12.4 years; women, 42.92 ± 11.34 years; men 39.16 ± 14.18 years. Intake of effective drugs on sleep, depression, weight and appetite, was higher in women than men, although there were not significant. Glucose and lipid profile reducing drugs and smoking status did not show any significant difference with sex.
Anthropometric, body composition and biochemical variables
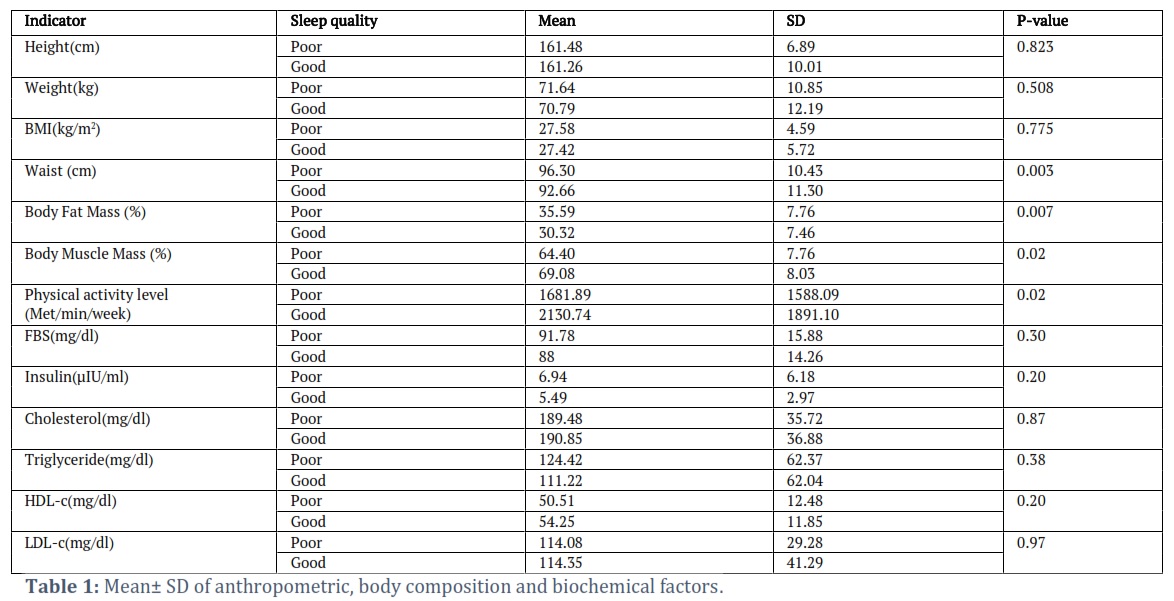
Table 1 shows mean ± SD of anthropometric measurements, body composition and biochemical factors by score of sleep quality. As shown in Table 1, waist circumference and body fat mass were higher in people with weaker sleep quality, while muscle mass and physical activity level were lower in those people. Weight, height, BMI, FBS, Insulin, Cholesterol, TG, HDL-C and LDL-C did not show any significant difference by score of sleep quality.
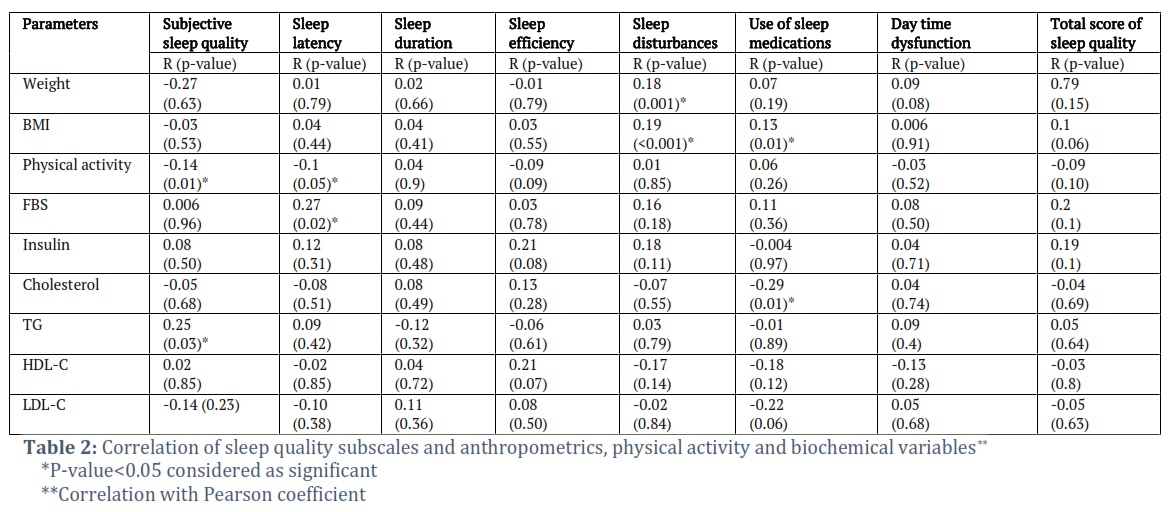
Table 2 shows correlation between all sleep quality subscales and anthropometrics, physical activity and biochemical variables by Pearson coefficient. Weight and BMI had positive correlation with subscale of “sleep disturbances” (P<0.001). BMI also had positive correlation with subscale of “use of sleep medication”. Physical activity had negative correlation with subscales of “subjective sleep quality” and “sleep latency”. FBS and TG had positive correlation with “sleep latency” and “Subjective sleep quality”, respectively (P <0.05). There was no significant correlation between any sleep-quality subscale and calorie or macronutrient intake (data not shown).
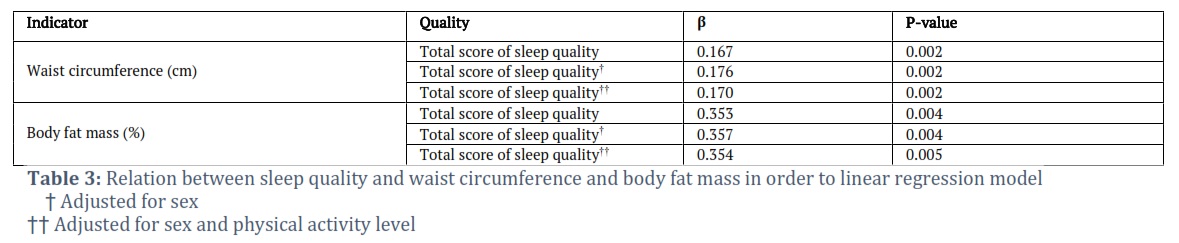
Table 3 shows the relation between waist circumference and body fat mass with sleep quality according to linear regression model. As this table shows, Each one-point increase in PSQI total score was related to 0.1 cm increase in waist circumference and 0.3 % increase in body fat percent (P <0.05). The results remained unchanged after adjusting for sex and physical activity level, as confounders.
Figures & Tables
Despite identification of many effective factors on obesity, the prevalence of obesity is increasing worldwide. So, investigation of other potential effective factors is very important. Our study showed that poorer sleep quality was significantly associated with greater waist circumference and higher body-fat mass. On the other hand, some subscales of sleep quality are associated with FBS, TG, BMI and physical activity level. Subjective sleep quality and sleep latency were associated with increase in FBS, TG and decrease in physical activity level. We should mention that higher scores of subscales of sleep quality, means the weaker sleep quality. So, poor sleep quality was associated with disorders in FBS and TG metabolism and decrease in physical activity level in present study. Our findings agree with Jennings [33] and Narang [34]. They have shown in their study that poor sleep quality is associated with increase in body fat mass and waist circumference. Poor sleep quality can disrupt secretion rhythm of melatonin, as a major mediator of balance between energy and body weight. It may lead to obesity and fat accumulation [35,36]. Some hormonal disorders may also occur due to poor sleep quality [38]. Findings of a meta-analysis showed that exercise training resulted in improvements in sleep quality in adults with sleep problems [37], although, other trials have found minimal to no improvements in sleep quality due to exercise training [38]. These controversial findings can be explained by different severity of sleep disorders and level of exercises in different studies. The association between poor sleep quality and increase in FBS and TG level in our study, is consistent with Khorasani and colleague’s study. They found that serum levels of TG in people with poor sleep quality is higher than those with good sleep quality [39]. In the current study, No association was found between sleep quality and total cholesterol, HDL-C, LDL-C, or insulin. These results agreed with Zhu and colleague’s’ study, that found no significant associations between PSQI score and these biochemical factors [40]. Poor sleep quality may have effects on FBS and TG through some mechanisms. For example, chronic or acute sleep deprivation can increase appetite through increase in ghrelin, an orexigenic hormone, and decrease in leptin as an anorexigenic factor [20,21]. These factors may lead to weight gain that in turn, can cause increase in FBS and TG level [10,22]. Furthermore, poor sleep quality decreases glucose uptake in skeletal muscle via the hypothalamic–sympathetic nervous system axis and β-adrenergic mechanisms due to decrease in leptin level [41]. Increasing in turnover of triglycerides, inhibiting the basal and insulin-stimulated de novo lipogenesis and stimulating the oxidation of glucose and free fatty acids are of the other probable mechanisms [42]. On the other hand, obesity could increase the risk of obstructive sleep apnea, which in turn, may increase metabolic impairment, including dyslipidemia [43,44]. Some of the subscales of sleep quality was associated with higher BMI in the current study.While increase in prevalence of obesity worldwide has been reported parallel to increase in sleep disorders,, the association between sleep disorders and obesity is not fully understood [45,46]. Some researchers showed that people suffering from sleep disorders are more prone to gain weight [47]. Some studies have suggested that diet quality may have a role on sleep quality [48]. Some nutrients may act on inflammatory hormonal responses involved in hunger-satiety mechanisms and energy metabolism. However, we did not find any significant association between dietary intakes and sleep quality. Our finding is inconsistent with some evidences showing that poor sleep quality is associated with higher calorie intakes and lower intakes of fish [49,50], energy‐dense foods [51] and vegetables [52-54]. These controversial findings may be for the reason of clinical characteristics of our participants. Our participants did not have any chronic diseases like diabetes, while most of the other studies have been conducted on people with diabetes or dyslipidemia. The other probable reason may be severity of sleep disorder in our participants. The mean total score of sleep quality in our study was 6.8, while the range of score is from 0 to 21. It is possible that sleep quality in our participants may not have been sufficiently poor to affect dietary intake. Investigating all subscales of sleep quality, in addition to total score of sleep quality and focusing on quality instead of quantity of sleep may be of the other probable reasons to find some controversial results. Since there was not any association between sleep quality and dietary intake, it seems that the correlation between poor sleep quality and higher BMI, waist circumference and body fat mass is more attributable to lower physical activity than higher energy intake. Furthermore, due to the design of the current study, it is not possible to determine whether weight gain leads to sleep disorders or sleep disorders lead to obesity. We suggest conducting prospective studies to assess causality.
Conclusion
Good sleep quality plays an important role as a modulator of weight, body fat mass, neuroendocrine function for glucose and triglyceride metabolism and physical activity. The current study confirmed an association between poor sleep quality and increased risk of obesity and dysregulation of glucose and triglyceride metabolism.
Strengths and Limitations
One strength of our study was considering all subscales of sleep quality, separately, instead of considering only the total score of sleep quality. Assessment of sleep quality, instead of its quantity (sleep duration), is the other strong point of the current study. As with other observational studies, there may be unmeasured confounding factors that affected the results. In addition, biochemical analyses were limited to a subsample (n = 90), which may affect the generalizability of the findings. For example, influences of common behavioral factors for delayed sleep onset among young people, including caffeine intake, use of electronics late at night and traditional methods to manage sleep, were not considered. Furthermore, the study design did not allow causal inference.
The authors declare that there is no conflict of interest.
Author Contributions
Study concept and design, analysis and interpretation of data: S.R; Acquisition of data and drafting of the manuscript: M.H and H.S; Critical revision of the manuscript: A.S.
![]() References
References
- Hung H-C, Yang Y-C, Ou H-Y, Wu J-S, Lu F-H, et al. The association between self-reported sleep quality and overweight in a Chinese population. Obesity (Silver Spring, Md), (2013); 21(3): 486-492.
- Paine S, Gander P, Travier N. The epidemiology of morningness/eveningness: influence of age, gender, ethnicity, and socioeconomic factors in adults (30-49 years). Journal of biological rhythms, (2006); 21(1): 68-76.
- Iyegha ID, Chieh AY, Bryant BM, Li L. Associations between poor sleep and glucose intolerance in prediabetes. Psychoneuroendocrinology, (2019); 110104444.
- Mokarrar M, Afsharmanesh A, Afshari M, Mohammadi F. Prevalence of Sleep Disorder among Medical Students in an Eastern University in Iran. Iranian Journal Of Health Sciences, (2017); 5(1): 49-54.
- Heidari Mokarrar M, Afsharmanesh A, Afshari M, Mohammadi F. Prevalence of sleep disorder among medical students in an Eastern university in Iran. Iranian Journal of Health Sciences, (2017); 5(1): 49-54.
- Gangwisch JE, Heymsfield SB, Boden-Albala B, Buijs RM, Kreier F, et al. Sleep duration as a risk factor for diabetes incidence in a large U.S. sample. Sleep, (2007); 30(12): 1667-1673.
- Makino S, Hirose S, Kakutani M, Fujiwara M, Nishiyama M, et al. Association between nighttime sleep duration, midday naps, and glycemic levels in Japanese patients with type 2 diabetes. Sleep Medicine, (2018); 444-11.
- Byrne EM, Gehrman PR, Trzaskowski M, Tiemeier H, Pack AI. Genetic Correlation Analysis Suggests Association between Increased Self-Reported Sleep Duration in Adults and Schizophrenia and Type 2 Diabetes. Sleep, (2016); 39(10): 1853-1857.
- Bjorvatn B, Sagen IM, Øyane N, Waage S, Fetveit A, et al. The association between sleep duration, body mass index and metabolic measures in the Hordaland Health Study. Journal of Sleep Research, (2007); 16(1): 66-76.
- Gangwisch JE, Malaspina D, Babiss LA, Opler MG, Posner K, et al. Short sleep duration as a risk factor for hypercholesterolemia: analyses of the National Longitudinal Study of Adolescent Health. Sleep, (2010); 33(7): 956-961.
- Kaneita Y, Uchiyama M, Yoshiike N, Ohida T. Associations of usual sleep duration with serum lipid and lipoprotein levels. Sleep, (2008); 31(5): 645-652.
- Kinuhata S, Hayashi T, Sato KK, Uehara S, Oue K, et al. Sleep duration and the risk of future lipid profile abnormalities in middle-aged men: the Kansai Healthcare Study. Sleep Medicine, (2014); 15(11): 1379-1385.
- Kong AP, Wing YK, Choi KC, Li AM, Ko GT, et al. Associations of sleep duration with obesity and serum lipid profile in children and adolescents. Sleep Medicine, (2011); 12(7): 659-665.
- Lin PMD, Chang K-T, Lin Y-A, Tzeng IS, Chuang H-H, et al. Association between self-reported sleep duration and serum lipid profile in a middle-aged and elderly population in Taiwan: a community-based, cross-sectional study. BMJ open, (2017); 7(10): e015964-e015964.
- Petrov MER, Kim Y, Lauderdale D, Lewis CE, Reis JP, et al. Longitudinal associations between objective sleep and lipids: the CARDIA study. Sleep, (2013); 36(11): 1587-1595.
- Sabanayagam C, Shankar A. Sleep duration and hypercholesterolaemia: Results from the National Health Interview Survey 2008. Sleep medicine, (2012); 13(2): 145-150.
- Shin HY, Kang G, Kim SW, Kim JM, Yoon JS, et al. Associations between sleep duration and abnormal serum lipid levels: data from the Korean National Health and Nutrition Examination Survey (KNHANES). Sleep Medicine, (2016); 24119-123.
- Zhan Y, Chen R, Yu J. Sleep duration and abnormal serum lipids: the China Health and Nutrition Survey. Sleep Medicine, (2014); 15(7): 833-839.
- Smiley A, King D, Harezlak J, Dinh P, Bidulescu A. The association between sleep duration and lipid profiles: the NHANES 2013–2014. Journal of Diabetes & Metabolic Disorders, (2019); 18(2): 315-322.
- Mullington JM, Chan JL, Van Dongen HP, Szuba MP, Samaras J, et al. Sleep loss reduces diurnal rhythm amplitude of leptin in healthy men. Journal of Neuroendocrinology, (2003); 15(9): 851-854.
- Spiegel K, Leproult R, Tasali E, Penev P, Van Cauter E. Sleep curtailment results in decreased leptin levels and increased hunger and appetite. Sleep, (2003); 26A174.
- Taheri S, Lin L, Austin D, Young T, Mignot E. Short sleep duration is associated with reduced leptin, elevated ghrelin, and increased body mass index. PLoS medicine, (2004); 1(3): e62-e62.
- Lampman RM, Schteingart DE. Effects of exercise training on glucose control, lipid metabolism, and insulin sensitivity in hypertriglyceridemia and non-insulin dependent diabetes mellitus. Medicine & Science in Sports & Exercise, (1991); 23(6): 703-712.
- Harris ML, Oldmeadow C, Hure A, Luu J, Loxton D, et al. Stress increases the risk of type 2 diabetes onset in women: A 12-year longitudinal study using causal modelling. PloS one, (2017); 12(2): e0172126-e0172126.
- Goodin B, Smith M, Quinn N, King C, McGuire L. Poor sleep quality and exaggerated salivary cortisol reactivity to the cold pressor task predict greater acute pain severity in a non-clinical sample Biological psychology, (2012); 91(1): 36-41.
- Rusch H, Guardado P, Baxter T, Mysliwiec V, Gill J. Improved Sleep Quality is Associated with Reductions in Depression and PTSD Arousal Symptoms and Increases in IGF-1 Concentrations. Journal of clinical sleep medicine : JCSM : official publication of the American Academy of Sleep Medicine, (2015); 11(6): 615-623.
- Patel P, Abate N. Body fat distribution and insulin resistance. Nutrients, (2013); 5(6): 2019-2027.
- Potter G, Skene D, Arendt J, Cade J, Grant P, et al. Circadian Rhythm and Sleep Disruption: Causes, Metabolic Consequences, and Countermeasures. Endocrine Reviews, (2016); 37(6): 584-608.
- Banks S, Dinges D. Behavioral and physiological consequences of sleep restriction. Journal of clinical sleep medicine : JCSM : official publication of the American Academy of Sleep Medicine, (2007); 3(5): 519-528.
- Simpson N, Banks S, Arroyo S, Dinges D. Effects of sleep restriction on adiponectin levels in healthy men and women. Physiology & Behavior, (2010); 101(5): 693-698.
- Buysse D, Reynolds C, Monk T, Berman S, Kupfer D. The Pittsburgh Sleep Quality Index: a new instrument for psychiatric practice and research. Psychiatry Research, (1989); 28(2): 193-213.
- Moghaddam M, Bakhtari Aghdam F, Asghari Jafarabadi M, Allahverdipour H, Dabagh Nikookheslat S, et al. The Iranian Version of International Physical Activity Questionnaire (IPAQ) in Iran: Content and Construct Validity, Factor Structure, Internal Consistency and Stability, (2012); 1073-1080.
- Jennings J, Muldoon M, Hall M, Buysse D, Manuck S. Self-reported sleep quality is associated with the metabolic syndrome. Sleep, (2007); 30(2): 219-223.
- Narang I, Manlhiot C, Davies-Shaw J, Gibson D, Chahal N, et al. Sleep disturbance and cardiovascular risk in adolescents. CMAJ, (2012); 184(17): E913-920.
- Cipolla-Neto J, Amaral F, Afeche S, Tan D, Reiter R. Melatonin, energy metabolism, and obesity: a review. J Pineal Res, (2014); 56(4): 371-381.
- Claustrat B, Brun J, Chazot G. The basic physiology and pathophysiology of melatonin. Sleep Medicine Reviews, (2005); 9(1): 11-24.
- Yang P, Ho K, Chen H, Chien M. Exercise training improves sleep quality in middleaged and older adults with sleep problems: a systematic review. J Physiother, (2012); 58157–163.
- Tworoger S, Yasui Y, Vitiello M. Effects of a yearlong moderate-intensity exercise and a stretching intervention on sleep quality in postmenopausal women. Sleep, (2003); 26830–836.
- Khorasani M, Mohammadpoorasl A. The association between sleep quality and metabolic factors and anthropometric measurements. Biotechnology and Health Sciences, (2016); 3(4): 25-31.
- Zhu B-Q, Li X-M, Wang D, Yu X-F. Sleep quality and its impact on glycaemic control in patients with type 2 diabetes mellitus. International Journal of Nursing Sciences, (2014); 1(3): 260-265.
- Minokoshi Y, Toda C, Okamoto S. Regulatory role of leptin in glucose and lipid metabolism in skeletal muscle. Indian Journal of Endocrinology and Metabolism, (2012); 16(Suppl 3): S562-568.
- Harris R. Direct and Indirect Effects of Leptin on Adipocyte Metabolism. Biochimica et biophysica acta, (2013); 1842.
- Tahrani AA. Obstructive sleep apnoea in diabetes: Does it matter? Diabetes and Vascular Disease Research, (2017); 14(5): 454–462.
- Said S, Mukherjee D, Whayne TF. Interrelationships with metabolic syndrome, obesity and cardiovascular risk. Current Vascular Pharmacology, (2016); 14(5): 415–425.
- Beccuti G, Pannain S. Sleep and obesity. Current opinion in clinical nutrition and metabolic care, (2011); 14(4): 402-412.
- Dempsey JA, Veasey SC, Morgan BJ, O'Donnell CP. Pathophysiology of sleep apnea. Physiological reviews, (2010); 90(1): 47-112.
- Muscogiuri G, Barrea L, Annunziata G, Di Somma C, Laudisio D, et al. Obesity and sleep disturbance: the chicken or the egg? Critical Reviews in Food Science and Nutrition, (2019); 59(13): 2158-2165.
- Hargens TA, Kaleth ES, Edwards, Butner KL. Association between sleep disorders, obesity, and exercise: A review. Nature and Science of Sleep, (2013); 527–35.
- Del Brutto OH, Mera RM, Ha JE, Gillman J, Zambrano M, et al. Dietary fish intake and sleep quality: a population-based study. Sleep Medicine, (2016); 17126-128.
- Katagiri R, Asakura K, Kobayashi S, Suga H, Sasaki S. Low intake of vegetables, high intake of confectionary, and unhealthy eating habits are associated with poor sleep quality among middle-aged female Japanese workers. Journal of Occupational Health, (2014); 56(5): 359-368.
- Kong F, Li H, Xu G, Ying Y, Gong Q, et al. Association of Dietary Behaviors and Sleep Quality: Results from the Adults Chronic Diseases and Risk Factors Survey of 2015 in Ningbo, China. International Journal of Environmental Research and Public Health, (2018); 15(9).
- Grandner MA, Kripke DF, Naidoo N, Langer RD. Relationships among dietary nutrients and subjective sleep, objective sleep, and napping in women. Sleep medicine, (2010); 11(2): 180-184.
- Brondel L, Romer MA, Nougues PM, Touyarou P, Davenne D. Acute partial sleep deprivation increases food intake in healthy men. American Journal of Clinical Nutrition, (2010); 91(6): 1550-1559.
- St-Onge MP. Sleep-obesity relation: underlying mechanisms and consequences for treatment. Obesity Reviews, (2017); 18 Suppl 134-39.
This work is licensed under a Creative Commons Attribution-Non Commercial 4.0 International License. To read the copy of this license please visit: https://creativecommons.org/licenses/by-nc/4.0![]()