

Full Length Research Article
Assessing the Diagnostic Precision of Chosen Equational Scores in Detecting Steatosis through Elastography
Sajid Alhaidari1*, B Charfeddine1, Talal Hadi2
Adv. life sci., vol. 11, no. 2, pp. 455-461, May 2024
*– Corresponding Author: Sajid Alhaidari (sajidhazim@gmail.com)
Authors' Affiliations
2. Basrah Hospital of Gastroenterology, Basrah Health Directorate, Basrah – Iraq
[Date Received: 14/10/2023; Date Revised: 17/03/2024; Date Available Online: 18/04/2024]
Abstract![]()
Introduction
Methods
Results
Discussion
References
Abstract
Background: Several non-interventional imaging studies, scoring systems, and biochemical markers are widely used nowadays to urgently diagnose stage and manage cases of non-alcoholic fatty liver disease (NAFLD) to avoid potential complications. The current study aimed to compare the sensitivity, specificity, and positive predictive values (PPR) of some widely used NAFLD-induced steatosis scoring systems.
Methods: Fifty patients confirmed with fatty liver by ultrasonography were recruited in this study. All patients underwent steatosis staging using FibroScan. For all patients, aspartate transaminase (AST), alanine transaminase (ALT), platelet count, and body mass index were measured for the calculation of aspartate transaminase to platelet ratio index (APRI), hepatic steatosis index (HSI), and AST/ALT equations. Sensitivity, specificity, and PPR for the three scoring systems were calculated compared to FibroScan scoring results as the standard validating system where S0 and S1 scores were considered negative while S2 and S3 scores were considered positive for hepatic steatosis.
Results: Sensitivity results were 45, 87.8, and 45.9%; specificity results were 30, 22.2, and 69.2%; and PPR results were 72, 83.7, and 82.9% for APRI, HSI, and AST/ALT ratio scoring equation, respectively.
Conclusion: Among the three steatosis scoring systems studied in the present study, the HSI was the most sensitive scoring system, and the AST/ALT ratio was the most specific scoring system compared to the FibroScan as the standard steatosis scoring system.
Keywords: Equational Scores; Steatosis; Elastography; AST/ALT; APRI
Introduction![]()
Non-alcoholic fatty liver disease (NAFLD) is one of the most common liver diseases affecting about 30% of the population [1]. Obesity, type 2 diabetes mellitus, and other clinical characteristics of metabolic syndrome were reported by many studies to be closely associated with NAFLD [2]. Within the pathological range of non-alcoholic steatohepatitis (NASH), a necro-inflammatory variant of NAFLD, simple steatosis most frequently progresses. Moreover, NAFLD has a high economic burden where patients with NASH-induced liver cirrhosis eventually need liver transplantation [1,2].
Since most NAFLD patients are typically asymptomatic, the diagnosis of such common liver chronic syndrome represents a real-world clinical practice challenge. Liver biopsy is the mainstay gold standard diagnostic element of NAFLD[3]. However, being an invasive costly technique prone to significant sampling errors, accurate non-invasive imaging techniques like ultrasound and biomarkers are an increasing medical demand [1]. Ultrasonography (USG) is one of the most common imaging diagnostic tools for hepatic steatosis where it can accurately detect abnormally increased hepatic echogenicity [4]. The sensitivity of USG ranges from 60 to 94% [5], while its specificity ranges from 84 to 95%. Furthermore, patients with a liver biopsy showing 20% steatosis[6] and those with a hepatorenal index higher than 1.34 [7], where a fatty liver score higher than 2 implies NAFLD, have much higher sensitivity [8].
FibroScan is a transient elastography imaging technique widely used to detect controlled attenuation parameters (CAP), measured in decibels per meter(db/m), which is a validated scoring system that diagnoses and categorizes hepatic steatosis[9]. A previous study reported that CAP, with a range of 100-400 db/m can detect significant steatosis, but it may be less accurate to differentiate between the hepatic steatosis grades [9] and classified steatosis grades, according to the FibroScan CAP scoring system as follows: S1 ≥ 263db/m, S2 ≥ 281db/m and S3 ≥283db/m[10].classified steatosis grades according to the FibroScan CAP scoring system as follows: S1 ≥ 238db/m, S2 ≥ 260db/m, and s3 ≥293db/m. FibroScan cannot predict extrahepatic complications, such as related cardiovascular events and non-hepatocellular cancers. There is increasing demand for using new non-invasive and affordable laboratory techniques dealing with serum biomarkers [11].
During the last few years, several serum biomarkers and biochemical tests for NAFLD hepatic steatosis have been extensively studied and validated. Among the different biomarkers studied for the NAFLD hepatic steatosis diagnosis and grading, aspartate transaminase to platelet ratio index (APRI) has been addressed as an increasing interest and has been intensively investigated in several studies for the diagnosis of NAFLD and other chronic liver morbidities, such as liver hepatitis [12]. The hepatic steatosis index (HSI) is an effective simple NAFLD diagnostic biochemical tool based on a logistic regression model. Gender, diabetic status, aspartate transaminase (AST), and alanine transaminase (ALT) are included to calculate HSI [13]. The HIS has a sensitivity of about 93% at an NAFLD cut-off exclusion value of < 30 and a specificity of about 92% at an NAFLD cut-off detection value of < 36 [14].
The current study aimed to validate the APRI, HSI, and AST/ALT ratio as NAFLD hepatic steatosis scoring systems compared to transient elastography FibroScan.
Methods![]()
A total of 50 patients above 18 years old were admitted to the specialized Gastrointestinal and Hepatology Unit of Basrah Hospital, affiliated with the Farhat Hached Hospital and the Ibn-Aljazzar Medical College in Sousse, from January 1, 2022, to December 30, 2022.The patients confirmed with fatty liver disease by USG were recruited in the current cross-sectional study.
Ethical approval
The study was approved by the Ethics Committee (Institutional Review Board) of the Ibn-Aljazzar College of Medicine, Sousse University, and the Basrah Health Council in Iraq. The study was conducted according to the Good Clinical Practice guidelines and the Declaration of Helsinki. All patients or their caregivers signed an informed consent after a detailed explanation of the study’s protocol before recruitment. Each patient was assigned a code number for analytical purposes only to ensure the anonymity and confidentiality of the patient. Incentives or rewards were offered for the patient’s participation in the study.
Inclusion criteria
Only individuals with positive ultrasonic fatty liver infiltrations who were at least 18 years old were included in this investigation.
Exclusion criteria
The study excluded patients with chronic liver disease, and macrovesicular steatosis, as well as those with excessive alcohol consumption, viral hepatitis (Hepatitis C-genotype 3), lipodystrophy, starvation, parenteral nutrition, abetalipoproteinemia, acute fatty liver of pregnancy, and the HELLP syndrome. Also excluded were patients with other inborn metabolic abnormalities that may be potential causes of microvesicular steatosis (such as lecithin-cholesterol acyltransferase deficiency, cholesterol ester storage disorder, and Wolman's disease) and patients administering medications (such as mipomersen, lomitapide, amiodarone, methotrexate, tamoxifen, and corticosteroids).
FibroScan examination
All recruited patients were examined by transient elastography using the FibroScan apparatus (Echosens, France). Controlled attenuation parameter (CAP) scores classified patients into 3 grades of steatosis as follows; S1: 238-260 db/m; S2: 261-290 db/m; and S3:> 290 db/m.
Laboratory tests
Blood samples of all patients were collected on the same day as their radiological tests and centrifuged using a centrifuge (EBA/200S, Hettich, Germany) for approximately 10 minutes at 3,500 revolutions per minute (rpm). It was separated into three aliquots. The first aliquot (2 ml of whole blood) was set aside for a coagulation test in a sodium citrate (3.2%) tube where prothrombin time (PT) and international normalized ratio(INR) were measured using PT and INR kits (Biolab, France). The second aliquot (2ml) was transferred to an ethylenediaminetetraacetic acid (EDTA) gel tube and left at room temperature between 18 and 25oC for 15 minutes. After coagulation, the sera were spun usingSpin200E (SPINREACT, Spain) at 3,000 rpm for 10 minutes. It was then analyzed for liver function tests; AST using AST colorimetric kit (SPINREACT, Spain) and ALT using ALT colorimetric kit (SPINREACT, Spain).For the third aliquot, platelet counts were measured by an automated hematological apparatus (Compact 5 Diff analyzer; SPINREACT, Spain).
Calculation of NAFLD hepatic steatosis biochemical scoring system
1- The APRI was calculated for each recruited patient by simply dividing AST concentration by platelet count.
2- The HSI was calculated for each patient by simply using the following formula:
HSI = 8 × (ALT/AST) + BMI (add 2 if diabetic and add 2 if female)
HSI: Hepatic steatosis index; ALT: Alanine transaminase; AST: Aspartate transaminase.
3- ALT/AST ratio was also calculated for all patients by simply dividing alanine transaminase concentration by aspartate transaminase concentration.
Biochemical scoring systems involve the assessment of sensitivity, specificity, and positive predictive value (PPV) to measure their effectiveness. Patients with an APRI score ≥0.29 were considered positive and those with a score <0.29 were considered negative for hepatic steatosis. Patients with HSI score ≥36 were considered positive and those <36 were considered negative for hepatic steatosis. Patients with ALT/AST ratio score of ≥0.9 were considered positive and those of <0.9 were considered negative for hepatic steatosis.
FibroScan was used as the gold standard technique to which all the calculated scoring system of the current study was compared. Patients who were diagnosed as positive by the FibroScan and the biochemical equation were considered true positives (TP) for all calculated scoring systems, while false positive (FP) patients were those who received a positive diagnosis from the biochemical equation but a negative diagnosis from the FibroScan. Furthermore, patients who obtained a negative diagnosis from the FibroScan as well as the scoring system were regarded as true negatives (TN). Those individuals who received a positive FibroScan diagnosis, but a negative biochemical equation diagnosis was considered false negatives (FN).
Sensitivity equation: TP/TP+FN×100
Specificity equation: TN/TN+FP× 100 × 100
Positive predictive value: (TP/TP+FP) × 100
TP: True positive; FN: False negative; TN: True negative; FP: False positive; PPV: Positive predictive value
Data analysis
Continuous data were presented as mean+standard deviation (SD) while variable non-continuous data were described as numbers and percentages (%).
Results![]()
Of the 50patients involved in this study, females constituted 46%. The average age of the individuals in the sample is approximately 31.64 years, with a standard deviation of 1.68 years. Sixty percent of the participants had a BMI greater than 30 (classified as obese). Thirty-two percent fell within the BMI range of 25 to 30 (classified as overweight) while 8% had a BMI less than 25 (classified as normal weight). Fourteen individuals (28%) were diabetic and 38 (76%) were positively identified by FibroScan as steatosis (Table 1).
The PPV for the APRI scoring system was 72%. This indicated that among the individuals predicted to have a condition (positive cases), 72% had the condition. For the HSI scoring system, the PPV was 85.71%. For the AST/ALT scoring system, the PPV was 80.96%. For the APRI scoring system, the specificity was 30%. This indicated that among the individuals who did not have the condition (negative cases), only 30% were correctly identified as negative. The specificity for the HSI scoring system was 22.22%.For the AST/ALT scoring system, the specificity was 69.20%. The sensitivity for the APRI scoring system was 45%.
This showed that among the individuals who had the condition (positive cases), 45% were correctly identified as positive. For the HSI scoring system, the sensitivity was 87.80%.The sensitivity for the AST/ALT scoring system was 45.90% (Table 2 and Figure 1).
Comparison between gender subgroup and total sample
For APRI, males and females had higher sensitivity and lower specificity than the total sample compared to specificity, which was lower. In the HSI, the male subgroup had similar sensitivity, but higher specificity compared to the total sample while the female subgroup had similar sensitivity, but lower specificity compared to the total sample. When compared to the total sample, the male subgroup for AST/ALT exhibited a higher specificity and a lower sensitivity. In contrast to the total sample, the female subgroup demonstrated a higher specificity but a comparable sensitivity. Concerning APRI, the female subgroup outperformed the male subgroup in terms of sensitivity and PPV but had a lower specificity (Figure 1A). For HSI, the female subgroup exhibited comparable PPV and sensitivity to the male sample, but lower specificity (Figure 1B). Comparing the female and male subgroups for AST/ALT, Table 3 and Figure 1C showed that the female subgroup's sensitivity, PPV, and specificity was comparable.
Across different BMI subgroups, variations were observed in the diagnostic performance of the scoring systems. In the group with a BMI greater than 30, the sensitivity of the HSI scoring system was notably higher compared to the APRI and AST/ALT scoring systems. However, the specificity of the HSI scoring system was lower compared to the other two scoring systems. The PPV of the AST/ALT scoring system was highest in this subgroup. Regarding the BMI subgroup of 25-30, the APRI scoring system exhibited the highest sensitivity, followed closely by the HSI scoring system. The specificity of both scoring systems was moderate, with the HSI scoring system showing a slightly higher value. However, the PPV of the APRI scoring system was notably higher compared to the other two scoring systems. In the subgroup with a BMI of less than 25, the APRI scoring system demonstrated perfect sensitivity, indicating its ability to correctly identify all positive cases. However, its specificity was relatively lower compared to the other two scoring systems. The HSI scoring system showed moderate sensitivity and specificity, while the AST/ALT scoring system had the highest specificity in this subgroup. However, the PPV of the AST/ALT scoring system was the lowest among the three scoring systems as presented in Table 4.
Figures & Tables
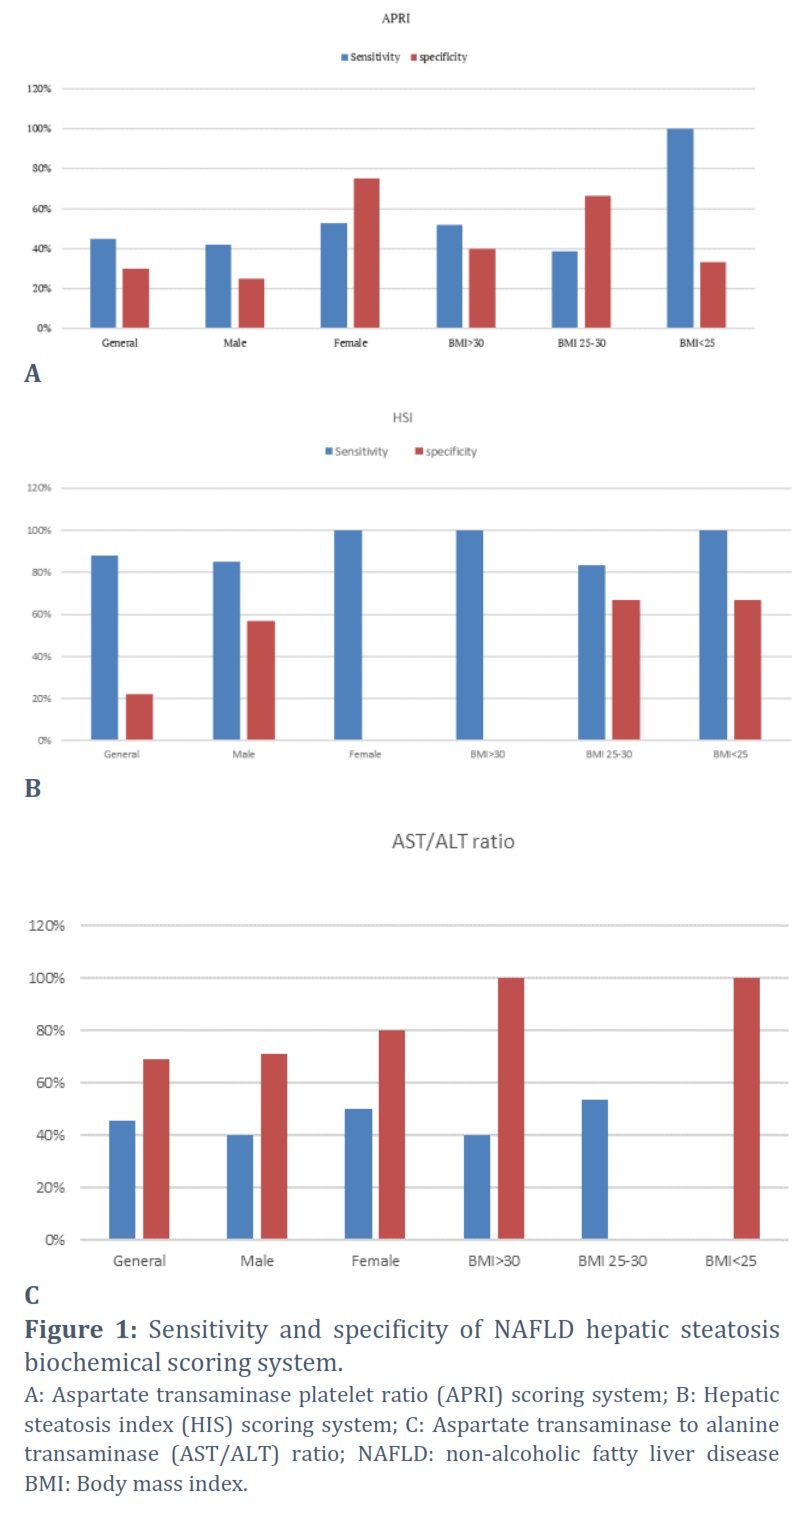
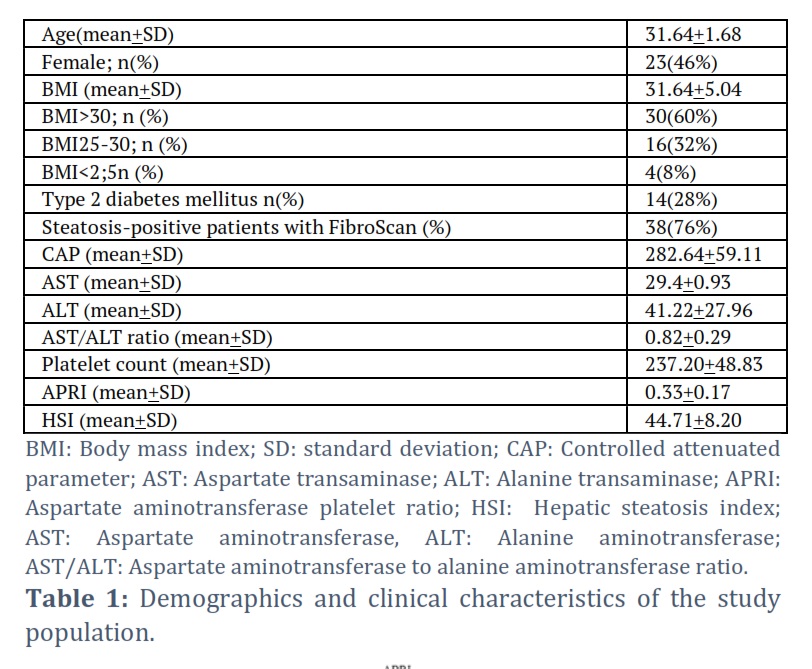
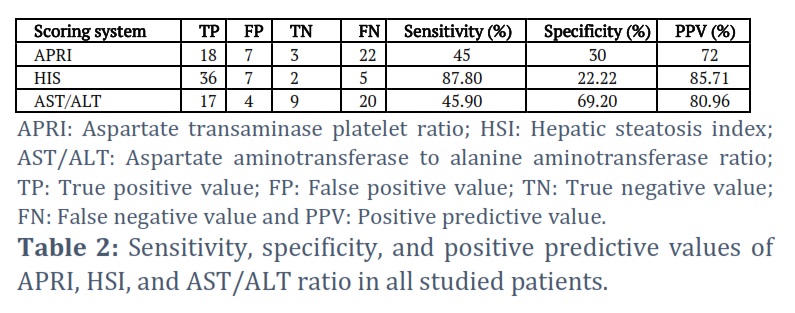

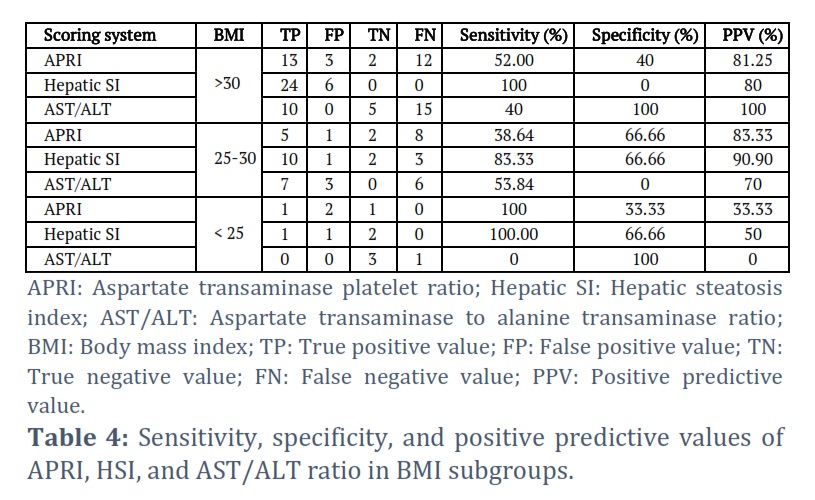
Table 1 illustrates all demographic data, clinical characteristics, and biochemical results of the study population. Table2 and Figure 1 depict true positive, false positive, true negative, false negative, sensitivity, specificity and positive predictive values of APRI, HSI, and AST/ALT ratio in all recruited patients, as well as in males, females, BMI>30 Kg/SM, BMI 25-30 Kg/SM, and BMI <30 Kg/SM patients’ subgroups, comparable to what was determined by Rodríguez-Antonio et al., [15]. The APRI steatosis scoring system demonstrated a 45% sensitivity rate across all patients in a study by Tovoa et al., when compared to the gold standard non-invasive diagnostic imaging tool, FibroScan transient elastography. However, APRI showed higher sensitivity in females (52.63%) compared to males (42.10%) and higher sensitivity in BMI<25 patients (100%) compared to BMI >30 (52%) and BMI 25-30 (38.64%) subgroups. APRI specificity reached 30% in all study groups, with higher specificity in females (75%) compared to males (25%), and higher specificity in BMI 25-30 (66.66%) compared to BMI>30 (40%) and BMI<30 (33.33%) subgroups [16]. The findings of the present study are consistent with those reported by Çiftçioğlu et al. (2023). When HSI was compared to FibroScan results, they found that it was 87.8% sensitive, with females having a higher sensitivity (100%) than males (85%), and higher sensitivity in both BMI>30 and BMI<25 (100%) than in BMI 25–30 (83.33%).The HSI demonstrated a specificity of 22.22% for hepatic steatosis, with a greater specificity observed in males (57.1%) and BMI < 30 (66.66%) [17].
The AST/ALT ratio was 45.9% among all recruited study subjects, with higher sensitivity in females (50%) compared to males (40%), and the highest sensitivity in BMI 25-30(53.84%) compared to other BMI groups. The specificity of the AST/ALT ratio among all patients was reported as 69.2% with higher values in females(80%) compared to males(71.42%) and in BMI>30 and BMI <25 groups [4]. The most sensitive biochemical equation among NAFLD hepatic steatosis scoring of biochemical equations, was HSI (87.8%), while the most specific one was AST/ALT (69.2%) according to the research conducted by Contreras et al. In the female group, HSI was the most sensitive (100%) and AST/ALT ratio was the most specific (80%). Meanwhile, the HSI was the most sensitive (85%) and the AST/ALT ratio was the most specific (71.42%) in the male group. Regarding BMI >30 groups, HSI was the most sensitive (100%) and AST/ALT ratio was the most specific (100%). The BMI 25–30 group showed the highest sensitivity (83.33%) and the highest specificity (66.66%) between HSI and APRI. Finally, in the BMI <25 group, both APRI and HSI were equally sensitive (100%), and AST/ALT ratio was the most specific (100%) [18].
Fatty liver is a clinical syndrome that leads to damage to the liver by triglyceride deposition in hepatocytes. Pure ethanol consumption of less than 30g in men and 20g in women daily is used to define NAFLD. Liver steatosis was defined, from the pathological point of view, as 30% fat in hepatocytes. However, in most recent clinical practice, greater than 5% fat in hepatocytes can be defined as NAFLD [19,20]. Liver biopsy was considered the gold standard diagnostic tool for fatty liver, particularly in non-alcoholic steatohepatitis (NASH) However, many factors such as invasiveness, pathologist dependency, and high rates of sampling errors have made liver biopsy a non-practical and inconvenient solution for a significant proportion of liver patients [21]. Abdominal sonar, magnetic resonance imaging (MRI), and computed tomography have been mainly used for the diagnosis of hepatic steatosis. However, many non-invasive tools, such as transient elastography CAP by FibroScan can be used for liver steatosis quantification. Moreover, several studies reported the efficacy of non-invasive biomarkers for diagnosis and scoring of NAFLD hepatic steatosis to reduce the invasiveness of liver biopsy [21]. The main goal of the current study was to validate the sensitivity and specificity of some NAFLD hepatic steatosis biochemical scoring systems, such as APRI, HSI, and AST/ALT ratio compared to FibroScan as the reference standard.
In the current study, 50 patients confirmed with non-alcoholic fatty liver disease by ultrasonography were recruited. FibroScan transient elastography was performed for all patients as the standard reference diagnostic technique. AST, ALT, platelet count, and BMI were measured for all patients to calculate the biochemical equations for APRI, HSI, and AST/ALT ratios as hepatic steatosis scoring systems to be validated compared to CAP results of FibroScan. Contreras et al., reported that steatosis biomarkers might be able to detect hepatic steatosis with poor accuracy for quantification of the disease[18]. The APRI and AST/ALT sensitivity results of the current study may support Contreras et al., results where both equations recorded low steatosis sensitivity that did not exceed 45% [18]. However, HSI sensitivity results indicated higher values among all studied patients (87.8%) and all studied subgroups (83%-100%). The HSI sensitivity findings of the current study do not agree with Mikolasevic et al. (2022), who reported poor diagnostic and quantitative accuracy of HSI for hepatic steatosis, but moderate APRI accuracy for advanced fibrosis diagnosis [22]. Also, Chung et al. (2021)reported an HSI sensitivity of 93.1% at a cut-off exclusion value of <30 [23]. These findings are in agreement with those of the present study where an HSI sensitivity of 87% at a cut-off exclusion value of <36 was recorded. However, Chung et al., [23] recorded an HSI specificity of 92.4% at a cut-off detection value of >36, which was greater than the HSI specificity records of the current study that slightly exceeded 20% at the same cut-off value.
AST/ALT ratio is a significant component of the non-alcoholic steatohepatitis clinical research network (NASH CRN) predictive model that yielded an area under receiving operating characteristics (AUROC) predictive values of 0.79 for NASH on liver biopsy [24]. These findings might differ from the current study’s AST/ALT ratio sensitivity result, which was as low as 45%. However, the current study reported higher AST/ALT ratio specificity results of 69.2% with significantly higher specificity (100%) in obese patients [24].
Conclusion
- Among the three investigated biochemical steatosis-scoring systems, HSI showed the highest sensitivity, and the AST/ALT ratio demonstrated the highest specificity for NAFLD hepatic steatosis compared to CAP.
- The results of transient elastography by FibroScan among all recruited participants are similar in males, females, and BMI>30 subgroups.
- The findings of the current study may support the use of HSI and AST/ALT ratio scoring systems as accurate alternatives to ultrasonography and FibroScan hepatic steatosis diagnostic tools.
- Larger scale multiple-site trials may be very important and recommended.
Conflict of Interest
The authors declare that there is no conflict of interest.
Sajid Alhaidari (SA) conducted all the laboratory experiments, and data analysis, while Charfeddine B. (CB) and Hadi Talal (HT) supervised the project and participated in writing the final draft of the manuscript.
![]() References
References
- Mikolasevic I MS, Wensveen TT, Grgic I, Jakopcic I, Stimac D, et al. Nonalcoholic fatty liver disease – A multisystem disease? World Journal Gastroenterology, (2016); 22(43): 9488–9505.
- Darvishi M AK, Toama MA, Hadrawi SK, Ramadan MF, Pirhadi M, et al. . A Review of the Effects of Omega-3 and Omega-6 on Alcoholic and Non-Alcoholic Fatty Liver. Advancements in Life Sciences, (2023); 10(4): 530–536.
- Çiftçioğlu M KB, Ispiroğlu M, Gişi K. Frequency of fibrosis in patients with incidentally detected hepatosteatosis. Revista da Associação Médica Brasileira, (2023); 70(1): 1-5.
- Waseem M SF, Khan R. Ultrasound Detected Non-Alcoholic Fatty Liver Disease Prevalence and its Risk Factors in Pakistani Population. Advancements in Life Sciences, (2022); 9(4): 607–611.
- Joseph AE SS, al-Sam S, Cook MG, Maxwell JD.. Comparison of liver histology with ultrasonography in assessing diffuse parenchymal liver disease. Clinical radiology, (1991); 43(1): 26-31.
- Dasarathy S DJ, Khiyami A, Joseph R, Lopez R, McCullough AJ. Validity of real-time ultrasound in the diagnosis of hepatic steatosis: a prospective study. Journal of hepatology, (2009); 51(6): 1061-1067.
- Shiralkar K JS, Bluth EI, Marshall RH, Dornelles A, Gulotta PM. Improved method for calculating hepatic steatosis using the hepatorenal index. Journal of Ultrasound in Medicine, (2015); 34(6): 1051-1059.
- Ballestri S LA, Romagnoli D, Carulli L, Losi L, Day CP, et al. . Ultrasonographic fatty liver indicator, a novel score that rules out NASH and is correlated with metabolic parameters in NAFLD. Liver International, (2012); 32(8): 1242-1252.
- Chan WK NMN, Mahadeva S. Controlled attenuation parameter for the detection and quantification of hepatic steatosis in nonalcoholic fatty liver disease. Journal of gastroenterology and hepatology, (2014); 29(7): 1470-1476.
- Sasso M BM, de Ledinghen V, Douvin C, Marcellin P, Poupon R, et al. Controlled attenuation parameter (CAP): a novel VCTE™ guided ultrasonic attenuation measurement for the evaluation of hepatic steatosis: preliminary study and validation in a cohort of patients with chronic liver disease from various causes. Ultrasound in medicine & biology, (2010); 36(11): 1825-1835.
- Liu K WV, Lau K, Liu SD, Tse YK, Yip TC, et al. . Prognostic Value of Controlled Attenuation Parameter by Transient Elastography. Official journal of the American College of Gastroenterology| ACG, (2017); 112(12): 1812-1823.
- De Matteis C CM, Graziano G, Battaglia S, Suppressa P, Piazzolla G, et al. . AST to Platelet Ratio Index (APRI) is an easy-to-use predictor score for cardiovascular risk in metabolic subjects. Scientific Reports, (2021); 11(1): 1-14.
- Sviklāne L OE, Dzērve Z, Kupčs K, Pīrāgs V, Sokolovska J. . Fatty liver index and hepatic steatosis index for prediction of non-alcoholic fatty liver disease in type 1 diabetes. Journal of gastroenterology and hepatology, (2018); 33(1): 270-276.
- Lee SS PS, Kim HJ, Kim SY, Kim MY, Kim DY, et al. Noninvasive assessment of hepatic steatosis: prospective comparison of the accuracy of imaging examinations. Journal of hepatology, (2010); 52(4): 579-585.
- Rodríguez-Antonio I L-SG, Reyes-Gómez VA, Contreras-Flores EH, Farías-García F, Espejel-Deloiza M, et al. . Laparoscopic cholecystectomy: Histopathological analysis of metabolic associated fatty liver disease and fibrosis. Annals of Hepatology, (2022); 27(2): 1-6.
- Tovo C V. V-NC, Leite NC, Panke CL, Port GZ, Fernandes S, et al. Transient hepatic elastography has the best performance in evaluating liver fibrosis in non-alcoholic fatty liver disease (NAFLD). Annals of hepatology, (2019); 18(3): 445–449.
- Vuppalanchi R ÜA, Van Natta ML, Cummings OW, Sandrasegaran KE, Hameed T, et al. Effects of Liver Biopsy Sample Length and Number of Readings on Sampling Variability in Nonalcoholic Fatty Liver Disease. Clinical Gastroenterology and Hepatology, (2009); 7(4): 481–486.
- Contreras D G-RA, Clark P, Barquera S, Denova-Gutiérrez E. Diagnostic accuracy of blood biomarkers and non-invasive scores for the diagnosis of NAFLD and NASH: Systematic review and meta-analysis. Annals of Hepatology, (2023); 28(1): 1-10.
- Chalasani N YZ, Lavine JE, Charlton M, Cusi K, Rinella M, et al.. The diagnosis and management of nonalcoholic fatty liver disease: Practice guidance from the American Association for the Study of Liver Diseases. Hepatology, (2018); 67(1): 328-357.
- Tokushige K IK, Ono M, Eguchi Y, Kamada Y, Itoh Y, et al. Evidence-based clinical practice guidelines for nonalcoholic fatty liver disease/nonalcoholic steatohepatitis 2020. Hepatology Research, (2021); 51(10): 1013-1025.
- HY. K. Recent advances in nonalcoholic fatty liver disease metabolomics. Clinical and molecular hepatology, (2021); 27(4): 553-559.
- Mikolasevic I DV, Krznaric-Zrnic I, Krznaric Z, Virovic-Jukic L, Stojsavljevic S, Grgurevic I, Milic S, Vukoja I, Puz P, Aralica M, Hauser G. The Accuracy of Serum Biomarkers in the Diagnosis of Steatosis, Fibrosis, and Inflammation in Patients with Nonalcoholic Fatty Liver Disease in Comparison to a Liver Biopsy. Medicina, (2022); 58(2): 1-14.
- Chung J PH, Kim YJ, Yu MH, Park S, Jung SI. Association of Hepatic Steatosis Index with Nonalcoholic Fatty Liver Disease Diagnosed by Non-Enhanced CT in a Screening Population. Diagnostics (Basel), (2021); 11(12).
- Martinou E PM, Stefanova I, Kaur V, Angelidi AM. Diagnostic Modalities of Non-Alcoholic Fatty Liver Disease: From Biochemical Biomarkers to Multi-Omics Non-Invasive Approaches. Diagnostics, (2022); 12(2): 1-11.
This work is licensed under a Creative Commons Attribution-Non Commercial 4.0 International License. To read the copy of this license please visit: https://creativecommons.org/licenses/by-nc/4.0