
Full Length Research Article
The relationship between Biochemical and Immunological parameters and their effect on gout patients
Kareema A. Dakhil1*, Manal A. Aziz2, Wajdy J. Majid3
Adv. life sci., vol. 12, no. 3, pp. 515-521, August 2025
*- Corresponding Author: Kareema A. Dakhil (Email: kareema-aliway@utq.edu.iq)
Authors' Affiliations
2. Ibn Sina University of Medical and Pharmaceutical Sciences, Iraq, Baghdad– Iraq
3. College of Medicine, University of Thi-Qar, Department of Biochemistry– Iraq
[Date Received: 13/12/2024; Date Revised: 28/02/2025; Available Online: 31/10/2025]
Abstract![]()
Introduction
Methods
Results
Discussion
References
Abstract
Background: Gout is thought to be an autoinflammatory illness because monosodium urate (MSU) crystals trigger the activation of NLRP3 inflammasome, which in turn triggers caspase-1 to release active cytokines. Yet, it is still unclear how blood cytokine levels relate to the symptoms and clinical indicators of the illness. The serum levels of Interleukin-6 (IL-6), Adiponectin (ADP), C-Reactive Protein (CRP), and Uric Acid (UA) were examined, and their relationship with clinical and laboratory findings was discussed.
Methods: ELISA was used to determine the clinical, laboratory, and cytokine levels of 80 male and female gout patients (gout group). The study also included 70 individuals without a history of arthritis for comparison.
Results: On analysis, 80 out of the 150 individuals had gout arthritis. Uric Acid, IL-6, and CRP concentrations were all noticeably more prevalent in patients than in the control group (P < 0.001). Furthermore, ADP levels in patients were considerably lower than those of the control group (P < 0.001) as well. The present results were examined for age, gender, and body mass index (BMI).
Conclusion: High mean levels of UA, CRP, and IL-6, in both male and female gouty patients, as well as low mean values of ADP, were discovered when biochemical parameters were evaluated. As a result, UA, IL-6, ADP, and CRP are concluded to be significant markers for the development of gout-related comorbidities and are key gout predictors.
Keywords: Gout, Uric Acid (UA), Interleukin-6 (IL-6), C-Reactive Protein (CRP), Adiponectin (ADP), Inflammation
Introduction![]()
Gout is a notable cause of significant public health with a direct impact on individuals' health and quality of life [1], with a prevalence ranging from 1 to 4 percent in different populations [2,3]. The pathophysiological process is characterised by high serum uric acid (sUA) concentrations, either due to reduced excretion of uric acid (70–90%) or enhanced uric acid production (10–30%) [4]. Gout is responsible for intense inflammation of joints and arthritic pain, which significantly impairs the patient’s quality of life [5,6]. Gout’s management is additionally complicated by a frequent co-existence of high blood pressure, cardiovascular disease, stroke, and chronic renal disease, influencing both progression of disease and choice of treatment [7].
The pathogenesis of gout is still complicated, yet it's mainly characterized by deposition of crystal monosodium urate (MSU) into joints, tendons, cartilage, and soft tissues, which evokes an inflammatory process. Hyperuricemia, indicated by a sUA level greater than 7.0 mg/dL, is the prevailing factor for gout development [8]. In experimental studies, it has been indicated that injury to a tissue causes the release of endogenous alarm signals promoting inflammation [9]. Notably, uric acid (UA) causes human mononuclear cells to release interleukins, including the inflammation-related protein interleukin-6 (IL-6) [10].
IL-6 is a cytokine that encourages inflammation and regulates the production of acute-phase proteins, all contributing to body defense against inflammation [11]. Its generation could be initiated by exposure of synoviocytes and monocytes to UA, which further accelerates the process of inflammation and even causes damage and destruction of joints and bones [12,13]. Interestingly, IL-6 has a number of characteristics that are similar to interleukin-1 (IL-1), which is also an inflammatory cytokine, such as being able to induce fever and the synthesis of acute-phase proteins [14,15].
Besides IL-6, adipokines, including adiponectin (ADP), were shown to play an important role in regulating urate levels and gout development [16,17]. Adiponectin is a cytokine produced by adipose tissue that regulates systemic inflammation, metabolism, and immune responses [18,19]. Adiponectin has been suggested by evidence to affect gout by regulating inflammation pathways and preventing the state of inflammation attendant upon hyperuricemia [20].
In addition, based on in vitro studies, UA enters vascular smooth muscle cells, triggering a pro-inflammatory response which leads to an increase in cell proliferation and production of inflammatory mediators, including CRP [21]. C-reactive protein (CRP) is among the best-characterized serum proteins used as a measure of inflammation. It rises to 1000-fold during an inflammatory state like gout [22]. CRP is synthesized by the liver upon stimulation by cytokines, such as IL-6, and correlates with the number of joints affected by gout. CRP starts rising within 4–6 hours of the inciting inflammatory event and peaks at 48–72 hours [23].
The interaction of sUA levels with IL-6 production has been clearly established by earlier literature [24]. The available evidence implicates high uric acid levels with increased production of IL-6 by human mononuclear cells, which, in turn, augments inflammation. The relationship highlights the importance of comprehending the interaction among such biomarkers in individuals with gout.
The purpose of the present research is to assess serum concentrations of IL-6, adiponectin (ADP), CRP, and uric acid (UA) among patients with gout and examine their relationships. Second, it intends to link these biomarkers with clinical and laboratory values and contrast them with a control population without gout. Through the assessment of such biomarkers, an understanding of the pathophysiological processes of inflammation occurring with gout and hints towards potential target points for treatments can be acquired.
Methods![]()
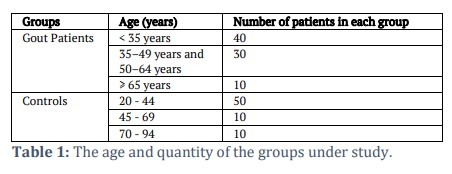
The investigation included the collection of 150 samples from Al-Hussein Teaching Hospital and specialty clinics, Thi-Qar, Iraq, from August 2021 until September 2022 (80 for patients with gout and 70 for controls). The age range for participants was 20-94 years in each group. For the diagnosis of the presence of gout among patients, blood samples of 150 individuals were collected, 80 of whom were diagnosed with gout and 70 were not. Every participant had a comprehensive clinical examination. Table 1 lists the participants' ages and numbers.
Measurements
This study used a Roche/Hitachi Cobas C311 system to detect blood uric acid levels, which automatically calculates the analyte concentration of each sample, and CRP levels were detected using CRP-LATEX (Germany–Japan) methods. Additionally, commercially available ELISA kits were utilized to assess the quantities of IL-6 and adiponectin (ADP), using kits from Sunlong Biotech and the Bioassay Technology Laboratory (BT LAB) in accordance with the manufacturer's directions.
Results![]()
Clinical and Characteristic Features of the Studied Groups
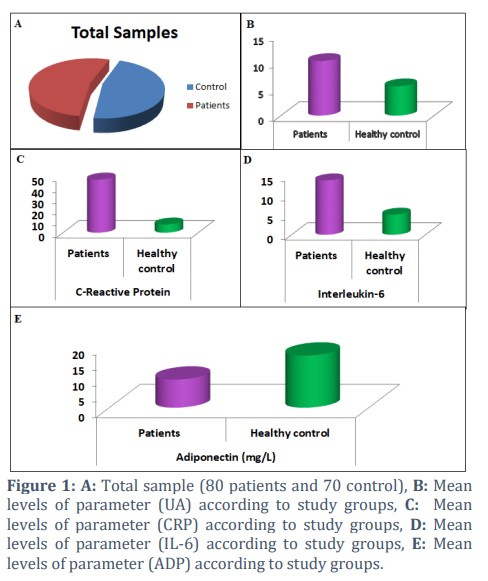
Figure 1A shows the current study, which includes 150 participants who were stratified for age (20-94 years) and BMI (normal weight, Overweight, and Obese). The patient group consisted of 80 individuals (57 males and 23 females), and the control group consisted of 70 healthy individuals, and their effect on all parameters was discussed.
Serum uric acid levels in healthy controls and gout patients
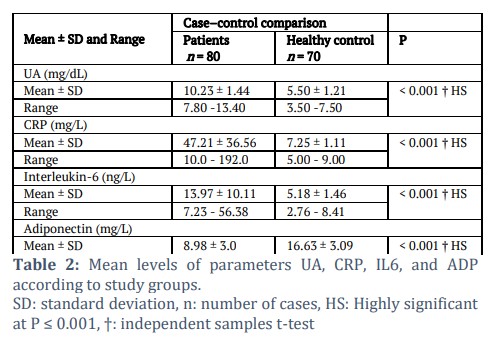
In Table 2, Figure 1B. According to the current findings, the mean sUA levels in gout patients were 10.23 ± 1.44 mg/dL versus 5.50 ± 1.21 mg/dL in healthy control participants, a substantially higher level (P < 0.001).
Comparison of CRP (Inflammatory Biomarker) levels between gout patients and healthy people
The mean serum CRP levels were 47.21 ± 36.56 mg/L and 7.25 ± 1.11 mg/L, as shown by Figure 1C and Table 2. It was observed that gout patients have a substantially greater CRP level than healthy individuals (P < 0.001) when comparing the two groups of people.
Immunological Analysis
Serum IL-6 levels in healthy controls and gout patients
In Table 2 and Figure 1D, mean serum IL-6 levels observed were 13.97 ± 10.11 ng/L and 5.18 ± 1.46 ng/L in patients with gout and healthy controls. It was observed that patients suffering from gout have a notably high serum IL-6 level in contrast to healthy individuals (P < 0.001).
Serum ADP concentrations in gout and non-gout test subjects
The mean levels of serum ADP in gout and non-gout subjects were 8.98 ± 3.0 mg/L and 16.63 ± 3.09 mg/L, as depicted in Table 2 and Figure 1E. It was observed that serum ADP in gout patients was significantly lower than that of the healthy control group (P < 0.001).
The Effect of Age on Studied Parameters
In the current study, the effect of the age factor was taken into account. Four age groups of participants in this study were created, as illustrated in Table 3A. By comparing patient outcomes across age groups, no considerable difference was identified.
Mean Levels of Parameters (UA, CRP, IL-6, ADP) according to Age Groups
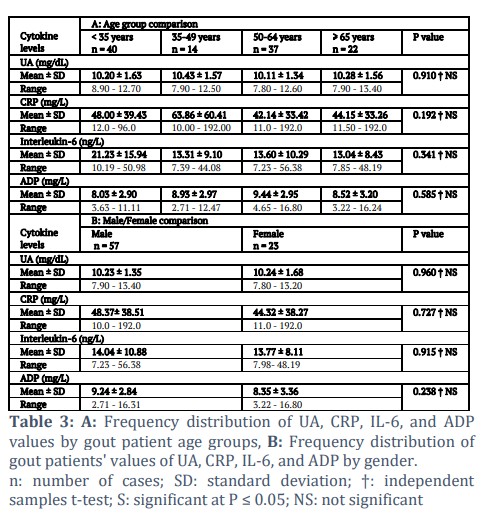
The current findings demonstrate that the mean sUA levels in patients in the age range of 35 to 49 years were non-significantly higher than the mean serum uric acid levels in other groups, as shown in Table 3A, which displayed the mean sUA levels probability value to be P = 0.910. Mean levels of serum CRP were 48.00 ± 39.43 mg/L, 63.86 ± 60.41 mg/L, 42.14 ± 33.42 mg/L, and 44.15 ± 33.26 mg/L. Patients in the age group 35-49 years exhibited higher mean CRP concentrations compared to the rest. However, the result was not significant (P = 0.192). Regarding mean serum IL-6 levels, they were 21.23 ± 15.94 ng/L, 13.31 ± 9.10 ng/L, 13.60 ± 10.29 ng/L, and 13.04 ± 8.43 ng/L for patients under 35, 35–49, 50–64, and over 65 years old, respectively. Patients in the age group under 35 had higher mean levels than those in the other age groups, but the difference was not statistically significant (P = 0.341). Also, mean levels of serum ADP for age groups like the previously mentioned were 8.03 ± 2.90 mg/L, 8.93 ± 2.97 mg/L, 9.44 ± 2.95 mg/L, and 8.52 ± 3.20 mg/L. Patients aged 50 to 64 had higher mean levels than other age groups, but the difference (P = 0.585) was not statistically significant.
The Effect of Gender on Studied Parameters
The gender factor was considered in the present research work; two gender groups of participants were created, as illustrated in Table 3B. The significant difference was determined by comparing each group's results to those of the corresponding control group.
The frequency distribution of UA, CRP, IL-6, and ADP values in gout patients by gender
Gout patients' serum levels for a few biochemical indicators have been compared based on gender, and the results are shown in Table 3B. In terms of sUA mean levels, the current findings indicate that male patients' mean sUA levels were non-significantly lower
than female patients' mean sUA levels, 10.23 ± 1.35 mg/dL and 10.24 ± 1.68 mg/dL, respectively (P = 0.960). Also, mean levels of serum CRP in men and women were 48.37 ± 38.51 mg/L and 44.32 ± 38.27 mg/L, respectively; although the difference was statistically nonsignificant (P = 0.727), male groups had higher mean levels than female groups. Whereas the mean serum IL-6 levels for male and female groups, respectively, were 14.04 ± 10.88 ng/L and 13.77 ± 8.11 ng/L. The mean values of the male and female groups were also statistically nonsignificant (P = 0.915). While the mean serum ADP levels for male and female groups, respectively, were 9.24 ± 2.84 mg/L and 8.35 ± 3.36 mg/L, there was no statistically significant difference between the mean levels of the two sexes (P = 0.238).
The Effect of BMI on Studied Parameters
In the current study, the effect of the BMI factor was considered; three groups (normal weight, Overweight, and Obese) of participants were created, as illustrated in Table 4. By comparing the patient outcomes across these three groups, no substantial differences were identified.
Frequency distribution of (UA, CRP, IL-6, ADP) levels according to the BMI of gouty patients
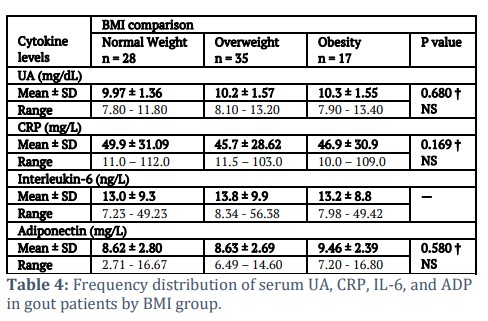
As shown in Table 4, slightly increased levels of sUA in obese people were observed relative to other categories, with a probability value, P = 0.680. Additionally, average serum CRP values were 49.9 ± 31.09 mg/L, 45.7 ± 28.62 mg/L, and 46.9 ± 30.9 mg/L. In comparison among normal weight, overweight, and obese patients, the highest mean values were seen in normal weight patients when compared with those in other categories. The difference was not statistically significant (P = 0.169). For IL-6, the mean levels were 13.0 ± 3.33 ng/L, 13.8 ± 3.05 ng/L, and 13.2 ± 2.11 ng/L. In patients who were normal weight, overweight, and obese, the mean values were greater in the overweight patients than in the other groups. However, the difference (P = 0.566) was not statistically significant. While the average serum levels of ADP were 8.62 ± 2.80 mg/L, 8.63 ± 2.69 mg/L, and 9.46 ± 2.39 mg/L in individuals who were normal weight, overweight, and obese, respectively, the variance in mean levels across the groups was also not statistically significant (P = 0.580).
Figures & Tables
Across the world, gout is a serious medical condition [25]. Gout is diagnosed based on clinical symptoms, indicators, and the findings of blood tests. In the present study, gout sufferers were assessed and categorized into age (20–90 years), gender (males and females), and BMI groups. Many studies have examined the gender gap in gout epidemiology; however, only a small portion of gout patients were female. The vast majority of research refers to gout as a “male sickness”, and most of the patients studied were men. Gout frequency in women increases after menopause; however, after the age of 60, both male and female patients with gout may experience the same incidence rate [26]. It was also discovered that men are more likely to get gout [25], which was the situation in the current study.
In the present study, Table 2 and Figure 1 showed that the patients' levels of sUA, CRP, and IL-6 were considerably higher than those of the control group (P < 0.001). It was also shown in Table 2 and Figure 1 that the level of ADP was considerably decreased in people suffering from gout than in the healthy control group, with P < 0.001. This demonstrates that blood UA and pro-inflammatory cytokines may be combined to increase the accuracy of the diagnosis of gout. One of the main causes of gout is thought to be hyperuricemia. It has been shown that all gouty patients develop hyperuricemia for at least a short while [27,28]. A strong association between levels of sUA and the likelihood of developing gout was studied in several research works [29-31]. Due to UA’s low solubility, chronic hyperuricemia creates harmful crystalline urate deposits around joints, which eventually lead to gout and destroy joints by inflaming them [32]. Hence, according to the primary gout definition specified by a 1977 criteria of American Rheumatism Association, among 12 gout diagnostic markers, hyperuricemia is one of them [33]. The gout group in the current study showed significantly increased sUA levels compared to the control group. Still, it is not particular that sUA levels are always higher in gout patients. On the contrary, gout can still occur even when sUA levels are at normal levels [34]. To increase the diagnostic precision of UA, further biochemical indications must be developed immediately. Gout’s pathogenesis is based on the innate immune system being activated, which results in the release of proinflammatory cytokines [35]. Serum levels of CRP and IL-6 in the patients in the current study were significantly greater than those in the control group, supporting the finding that these markers were significantly elevated in people who had acute gout attacks [36]. Although it is well known that UA crystals play a role in the etiology of gout, the current study’s patients’ serum ADP levels were significantly lower than those in the control group. This finding is consistent with the finding that acute gout patients had significantly lower concentrations of ADP, which can cause inflammation. Moreover, increasing blood UA levels have been linked to higher levels of proinflammatory cytokines [37,38]. These results imply that UA in combination with CRP and IL-6, two pro-inflammatory cytokines, may be a valuable tool for the identification of gout. Since rheumatoid arthritis (RA), gout and pseudogout, ankylosing spondylitis (AS), osteoarthritis (OA), and psoriatic arthritis (PsA) are the most prevalent types of inflammatory arthritis [39], finding reliable biochemical markers that can separate gout patients from those with other kinds of inflammatory arthritis is essential.
The results of comparing serum levels (UA, CRP, IL-6, and ADP) between age groups, as well as in this investigation (Table 3A), indicate that sUA values in the 35-49 age group patients were higher but not significantly so than those in other groups (P = 0.910). The mean serum CRP value was highest in patients in the age range of 35 to 49 compared to other groups, while the difference wasn't statistically significant (P = 0.192) in those under 35, 35 to 49, 50 to 64, and more than 65 years old, respectively. Furthermore, serum IL-6 levels were highest in the youngest age group (<35 years) compared to older subjects; this difference was not statistically significant (P = 0.341). Moreover, it was found that mean levels of serum Adiponectin were higher in patients in the 50–64 age group than in the other groups, but the difference was not statistically significant (P = 0.585).
The comparison of serum UA, CRP, IL-6, and ADP levels between gender groups has been carried out, and the results are shown in Table 3B. According to the current findings, the mean levels of sUA in patients who were male were not significantly lower than those in patients who were female. Mean levels of serum CRP were higher in males in comparison with females, but the difference was non-significant (P = 0.727). The mean levels of serum IL-6 in male groups were greater than the mean levels in female groups, although this difference was not statistically significant (P = 0.915). Although the difference between the mean levels of serum ADP in male and female groups was not statistically significant (P = 0.238), the mean levels were greater in the male group.
Finally, a comparison was made between levels of serum (UA, CRP, IL-6, ADP), with respect to BMI, as shown in Table 4. Analysis showed that obese patients had slightly higher sUA levels than other comparison groups, although this was not statistically significant (P = 0.680). Also, the mean levels of serum CRP in patients with normal weight had greater mean levels than the other groups, though the difference was not statistically significant (P = 0.169). For IL-6, the mean levels were greater in the overweight patients than in the other groups, with P = 0.566, which was statistically nonsignificant. The mean values of serum ADP were greater in obese patients compared to other groups, with P = 0.580, which was statistically nonsignificant in normal weight, overweight, and obese patients, respectively.
According to some research, sUA levels may help swiftly identify gout from other inflammatory arthritis [40,41]. But it is not always the case because the diagnostic accuracy of gout from other inflammatory arthritis patients cannot always be achieved by only combining increased sUA levels with levels of cytokines having a proinflammatory effect. More studies must be conducted to examine other biomarkers, but not proinflammatory cytokines, to boost the identification of gout individuals from patients suffering from various forms of inflammatory arthritis.
Acknowledgement
For their significant assistance in aiding patient enrollment and sample collection, the research team would like to thank the medical personnel at Al-Hussein Teaching Hospital. The researchers acknowledge the laboratory/technical staff’s help with the biochemical analysis and data interpretation.
Author Contributions
All authors worked together in writing the manuscript and approved the final version of the manuscript
The authors declare that they have no conflict of interest regarding the publication of this work.![]()
References
- Dehlin M, Jacobsson L, Roddy E. Global epidemiology of gout: prevalence, incidence, treatment patterns and risk factors. Nature Reviews Rheumatology, (2020); 16(7): 380-390.
- Singh JA, Gaffo A. Gout epidemiology and comorbidities. Seminars in arthritis and rheumatism. (2020); 50(3): S11-S16.
- Kuo CF, Grainge MJ, Zhang W, Doherty M. Global epidemiology of gout: prevalence, incidence and risk factors. Nature reviews rheumatology, (2015); 11(11): 649-662.
- Teng GG, Nair R, Saag KG. Pathophysiology, clinical presentation and treatment of gout. Drugs, (2006); 66(2006): 1547-1563.
- Martinon F, Pétrilli V, Mayor A, Tardivel A, Tschopp J. Gout-associated uric acid crystals activate the NALP3 inflammasome. Nature, (2006); 440(7081): 237-241.
- Terkeltaub R. What makes gouty inflammation so variable?. BMC medicine, (2017); 15(2017): 1-10.
- Rothenbacher D, Kleiner A, Koenig W, Primatesta P, Breitling LP, et al. Relationship between Inflammatory Cytokines and Uric Acid Levels with Adverse Cardiovascular Outcomes in Patients with Stable Coronary Heart Disease. PLoS ONE, (2012); 7(9): 1-8.
- Guerne PA, Terkeltaub R, Zuraw B, Lotz M. Inflammatory microcrystals stimulate interleukin‐6 production and secretion by human monocytes and synoviocytes. Arthritis & Rheumatism: Official Journal of the American College of Rheumatology, (1989); 32(11): 1443-1452.
- Braun T, Schett G. Pathways for bone loss in inflammatory disease. Current osteoporosis reports, (2012); 10(2012): 101-108.
- Zhang Z, Wang P, Xiong Q, Xu S, Kang D, et al. Advancements in the study of IL-6 and its receptors in the pathogenesis of gout. Cytokine, (2024); 182(2024): 1-9.
- Cavalcanti NG, Marques CD, Lins e Lins TU, Pereira MC, Rêgo MJ, et al. Cytokine profile in gout: inflammation driven by IL-6 and IL-18?. Immunological investigations, (2016); 45(5): 383-395.
- Swaak AJ, Rooyen AV, Nieuwenhuis E, Aarden LA. Interleukin-6 (IL-6) in synovial fluid and serum of patients with rheumatic diseases. Scandinavian journal of rheumatology, (1988); 17(6): 469-474.
- Cong R, Zhang X, Song Z, Chen S, Liu G, et al. Assessing the causal effects of adipokines on uric acid and gout: A two-sample mendelian randomization study. Nutrients, (2022); 14(5): 1-11.
- Orlova IV, Stanislavchuk MA. Clinical significance of adipokine profile (leptin and adiponectin) in patients with gout. PAIN, JOINTS, SPINE, (2023); 13(2): 108-115.
- Maeda N, Funahashi T, Matsuzawa Y, Shimomura I. Adiponectin, a unique adipocyte-derived factor beyond hormones. Atherosclerosis, (2020); 292(2020): 1-9.
- Otero M, Lago R, Lago F, Casanueva FF, Dieguez C, et al. Leptin, from fat to inflammation: old questions and new insights. FEBS letters, (2005); 579(2): 295-301.
- Tilg H, Moschen AR. Adipocytokines: mediators linking adipose tissue, inflammation and immunity. Nature reviews immunology, (2006); 6(10): 772-783.
- Kang DH, Park SK, Lee IK, Johnson RJ. Uric acid–induced C-reactive protein expression: implication on cell proliferation and nitric oxide production of human vascular cells. Journal of the American Society of Nephrology, (2005); 16(12): 3553-3562.
- Sautin YY, Nakagawa T, Zharikov S, Johnson RJ. Adverse effects of the classic antioxidant uric acid in adipocytes: NADPH oxidase-mediated oxidative/nitrosative stress. American Journal of Physiology-Cell Physiology, (2007); 293(2): C584-C596.
- Han L, Zhang L, Hu W, Lu Y, Wang Z. Association of C-reactive protein with all-cause and cause-specific mortality in people with gout. European Journal of Medical Research, (2024); 29(1): 1-10.
- Tagoe CE, Raza Y. Differences in acute phase reactants between gout and pseudogout. International Journal of Clinical Medicine, (2013); 4(12): 13-19.
- Rose-John S. IL-6 trans-signaling via the soluble IL-6 receptor: importance for the pro-inflammatory activities of IL-6. International journal of biological sciences, (2012); 8(9): 1237–1247.
- Johnson RJ, Kang DH, Feig D, Kivlighn S, Kanellis J, et al. Is there a pathogenetic role for uric acid in hypertension and cardiovascular and renal disease?. Hypertension, (2003); 41(6): 1183-1190.
- Zha X, Yang B, Xia G, Wang S. Combination of uric acid and pro-inflammatory cytokines in discriminating patients with gout from healthy controls. Journal of inflammation research, (2022); 15(2022): 1413-1420.
- Janssens HJ, Fransen J, Van de Lisdonk EH, van Riel PL, van Weel C, et al. A diagnostic rule for acute gouty arthritis in primary care without joint fluid analysis. Archives of internal medicine, (2010); 170(13): 1120-1126.
- Bernal JA, Quilis N, Andrés M, Sivera F, Pascual E. Gout: optimizing treatment to achieve a disease cure. Therapeutic advances in chronic disease, (2016); 7(2): 135-144.
- Trifirò G, Morabito P, Cavagna L, Ferrajolo C, Pecchioli S, et al. Epidemiology of gout and hyperuricaemia in Italy during the years 2005–2009: a nationwide population-based study. Annals of the rheumatic diseases, (2013); 72(5): 694-700.
- Luk AJ, Simkin PA. Epidemiology of hyperuricemia and gout. The American Journal of Managed Care, (2005); 11(15 Suppl): S435-S442.
- Primatesta P, Plana E, Rothenbacher D. Gout treatment and comorbidities: a retrospective cohort study in a large US managed care population. BMC musculoskeletal disorders, (2011); 12(2017): 1-7.
- Bardin T, Richette P. Impact of comorbidities on gout and hyperuricaemia: an update on prevalence and treatment options. BMC medicine, (2017); 15(2017): 1-10.
- Choi HK, Ford ES. Prevalence of the metabolic syndrome in individuals with hyperuricemia. The American journal of medicine, (2007); 120(5): 442-447.
- Stamp L, Dalbeth N. Screening for hyperuricaemia and gout: a perspective and research agenda. Nature Reviews Rheumatology, (2014); 10(12): 752-756.
- Rock KL, Kataoka H, Lai JJ. Uric acid as a danger signal in gout and its comorbidities. Nature Reviews Rheumatology, (2013); 9(1): 13-23.
- Wallace SL, Robinson H, Masi AT, Decker JL, McCarty DJ, et al. Preliminary criteria for the classification of the acute arthritis of primary gout. Arthritis & Rheumatism, (1977); 20(3): 895-900.
- Schlesinger N. Diagnosing and treating gout: a review to aid primary care physicians. Postgraduate medicine, (2010); 122(2): 157-161.
- Cabău G, Crișan TO, Klück V, Popp RA, Joosten LA. Urate‐induced immune programming: Consequences for gouty arthritis and hyperuricemia. Immunological reviews, (2020); 294(1): 92-105.
- Jiang X, Li M, Yang Q, Du L, Du J, et al. Oxidized low density lipoprotein and inflammation in gout patients. Cell biochemistry and biophysics, (2014); 69(2014): 65-69.
- Higgins P, Dawson J, Walters M. The potential for xanthine oxidase inhibition in the prevention and treatment of cardiovascular and cerebrovascular disease. Cardiovascular Psychiatry and Neurology, (2009); 2009(1): 1-9.
- Jin M, Yang F, Yang I, Yin Y, Luo JJ, et al. Uric acid, hyperuricemia and vascular diseases. Frontiers in bioscience: a journal and virtual library, (2012); 17(2012): 656–669.
- Tang Y. Prevalence of Doctor-Diagnosed Arthritis and Arthritis-Attributable Activity Limitation–United States, 2010-2012. Morbidity and Mortality Weekly Report, (2013); 62(44): 869–873.
- Lenski M, Scherer MA. Analysis of synovial inflammatory markers to differ infectious from gouty arthritis. Clinical Biochemistry, (2014); 47(1-2): 49-55.
This work is licensed under a Creative Commons Attribution-Non Commercial 4.0 International License. To read the copy of this license please visit: https://creativecommons.org/licenses/by-nc/4.