

Full Length Research Article
Implementation of laser-induced breakdown spectroscopy (LIBS) technique in evaluating of renal failure in patients with iron (Fe) deficiency
Iman Sami1*, Muayyed Jabar Zoory1, Sadiq Hassan Lefta2
Adv. life sci., vol. 11, no. 1, pp. 66-71, February 2024
*– Corresponding Author: Iman Sami (muayyedjz@uomustansiriyah.edu.iq)
Authors' Affiliations
2. Department of Physics, College of Science for Women, Babylon University, Hella– Iraq
[Date Received: 18/06/2023; Date Revised: 04/08/2023; Date Published: 25/02/2024]
Abstract![]()
Introduction
Methods
Results
Discussion
References
Abstract
Background: Iron deficiency is known to have implications for kidney function, and its association with renal failure has prompted investigations into novel diagnostic tools. This study explores the potential of Laser Breakdown Spectroscopy (LIBS) as a diagnostic technique for identifying renal failure in iron-deficient patients.
Methods: Blood samples from patients with renal failure and iron deficiency were subjected to LIBS analysis, with results compared to samples from healthy individuals. LIBS involves directing a high-energy laser onto the sample, generating plasma that emits distinctive spectral lines. The elemental composition of the sample can be determined by analyzing these lines.
Results: Statistically significant differences in the initial composition of blood samples were observed between patients with renal failure and iron deficiency, as opposed to those from healthy individuals. Specific elemental markers indicative of renal failure in iron-deficient patients were identified through LIBS analysis.
Conclusion: This study suggests that LIBS holds promise as a cost-effective and efficient diagnostic tool for detecting renal failure in iron-deficient patients. The identification of specific elemental markers offers potential for targeted diagnostic interventions, emphasizing the clinical utility of LIBS in the realm of renal health assessment.
Keywords: Plasma; Blood Minerals; Patients with Chronic Renal Failure; Iron Element
Introduction![]()
Iron deficiency is a common problem among patients with kidney failure, which can lead to a range of serious health problems and negatively affect their quality of life[1]. Diagnosing and treating iron deficiency in these patients is very tedious and presents many challenges, as renal failure is characterized by the inability of the kidneys to filter excess fluid and waste products from the blood. This can lead to a chemical imbalance in the body and the buildup of toxic waste, which can lead to low levels of iron in the blood [2]. In addition, treatment for kidney failure may lead to iron loss. Dialysis and filtration sessions are used to remove excess iron from the body[2]. This occurs when the kidneys become unable to adequately filter waste and excess fluid from the blood, leading to a buildup of toxins and other harmful substances in the body [3]. Kidney failure can be caused by a variety of factors, including chronic diseases such as diabetes and high blood pressure, as well as certain medications, infections, and genetic disorders. Despite advances in medical technology and treatments, kidney failure remains a major public health challenge, with high incidence, morbidity, and mortality [4]. Patients with kidney failure often require lifelong dialysis or a kidney transplant, which can have a significant impact on their quality of life and place a huge burden on healthcare systems. The underlying causes and risk factors for renal failure, as well as to develop more effective prevention and treatment strategies [5]. Renal failure, a condition characterized by the loss of kidney function, affects millions of people worldwide and is a major cause of morbidity and mortality [6]. Early diagnosis of renal failure is crucial for effective treatment and management. However, current diagnostic techniques for renal failure often require invasive procedures or are limited in their ability to detect disease in its early stages [6]. Therefore, new, non-invasive diagnostic techniques that can accurately detect and monitor renal failure are needed. LIBS is a laser-based analytical technique that uses a highly focused laser beam to create a plasma on the surface of a sample, which emits distinct spectral lines that can be used to determine the elemental composition of a sample. LIBS has several advantages over conventional diagnostic techniques, including its non-invasive nature, high sensitivity, and ability to detect multiple items simultaneously. LIBS (Laser Induced Breakdown Spectroscopy) is a type of analytical technique that uses a laser to vaporize a small amount of a plasma forming sample [7]. This plasma then emits light that can be analyzed to determine the chemical composition of the sample. In medicine, LIBS technology has been used in a wide variety of applications. For example, it has been used to detect heavy metals in tissues and biological fluids, such as iron in blood samples. It has also been used to identify microorganisms, such as bacteria and viruses, in clinical samples. One potential application of the LIBS technique in medicine is cancer diagnosis [8]. Cancer cells have different chemical compositions than normal cells, and the Laser-induced breakdown spectroscopy (LIBS ) technique can be used to detect these differences in tissue samples. This can lead to faster and more accurate diagnosis of cancer, allowing for earlier treatment and better patient outcomes [9]. However, more research is needed to fully understand the capabilities and limitations of this technology in a clinical setting. for the diagnosis of renal failure. LIBS can detect elements such as potassium, calcium, magnesium, iron, and zinc. Despite its potential, there is still much to learn about the application of LIBS for the diagnosis and monitoring of renal failure in humans [10]. This includes developing standardized protocols for sample preparation, improving LIBS standards, and validating results using clinical data. However, with the continuous development of this technology and continuous research efforts [11]. The aim of this research is to highlight the challenges and importance of diagnosing and treating iron deficiency in patients with renal failure, as well as to explore the potential application of laser-induced breakdown spectroscopy (LIBS) for the diagnosis and monitoring of renal failure.
Methods![]()
a. Preparation of experimental samples
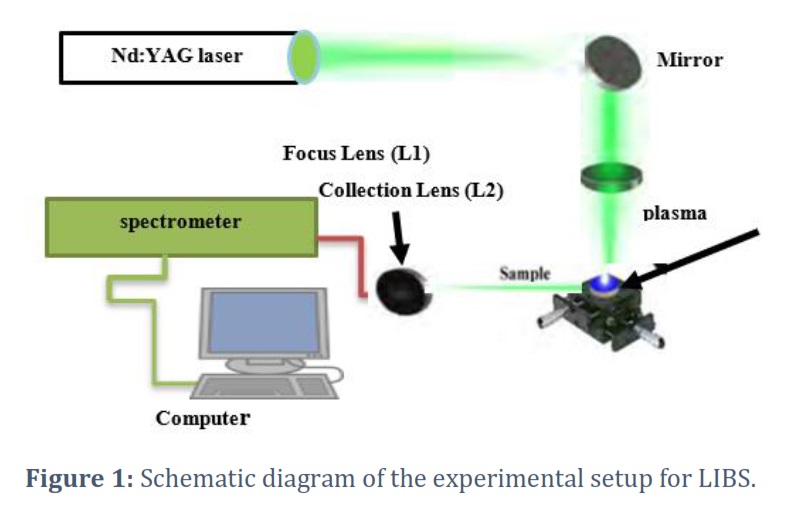
The blood plasma samples of patients with renal failure were provided by the Medical City Hospital in Baghdad, Iraq, with different levels of urea and creatine. Samples were used without any modification. We took a sample of the blood of an infected person and a sample of the blood of a healthy person using a centrifuge as shown in Figure (1). The surface of the sample with a lens with a focal length of 10 cm. The plasma was formed at a frequency of 1 Hz avoiding damage or delamination of the surface of the material. We collected the plasma spectrum of the fiber, passed it through the optical fiber, and then added the data in the form of intensity as a function of wavelength.
b. Experimental setup
The device consists of a Q-switching Nd-YAG laser with a pulse duration of 10 ns, a pulse repetition frequency of 1 Hz, and a wavelength of 1064 nm. At the focal length of the converging lens (f = 10 cm), a laser beam was focused on the sample’s surface. Optical fiber set at 45° with beam directed at 10 cm from plasma, vaporization, and ionization produced by the sample. The spectra of laser-target plasma offer spectroscopic information. A fiber optic cable connects the spectrum analyzer to the plasma emission spectrum (FOC). A spectrum analyzer is connected to a charge-coupled device (CCD) with an array of detectors to record spectral lines. Thorlabs’ PC program and a spectrum analyzer (CCS 100/M) with a resolution of 0.5 nm and a time integration of 800 s were used to acquire the spectrum over a wavelength range of 321–740 nm. NIST provided all spectrum data [12]. Optical emission spectra were recorded for plasma ablation from the surfaces of medical samples for patients with chronic renal failure using an experimental LIBS system, which is shown in Fig.1.
c. Nd:YAG Laser
The type of pulse laser utilized for LIBS is Nd:YAG (Neodymium-doped yttrium aluminum garnet), it is a kind of solid-state lasers was used as laser medium with 1064 nm fundamental wavelength and a repetition rate of 1 Hz for plasma excitation. It operated in the Q-switching mode to obtain short pulse duration in 10 ns range to get a high peak power in the megawatt range.
Results![]()
Exploring the emission spectral of iron traces in serum
In the accompanying pictures, in particular, the emission spectra from iron traces discovered in the serum of three different groups—affected people, healthy people, and impacted people—are displayed. These figures concentrate on showing a variety of emission spectra that fall within the wavelength range of 340.760-624.758 nm.
Exploring plasma electron temperature and density
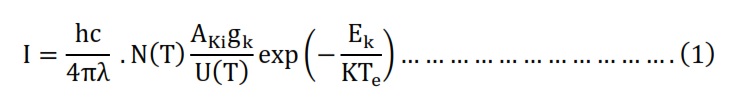
The Boltzmann equation had been utilized to formulate a Boltzmann diagram, serving as a method for ascertaining the temperature of electrons. The spectral line intensity (I) linked to the transition between two atomic energy levels, Ek and Ei, had been determined using the equation 1 [13].
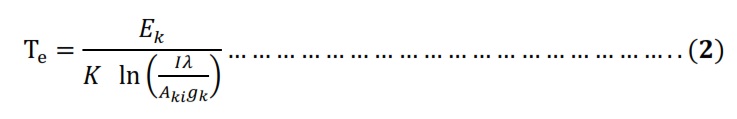
Also, can measure the electron temperature to one emission spectral become as shown in equation 2 [14].
The plasma electron density identifies the number of ions/electrons that will interact with the laser and subsequently the variation in the characteristics of each energy source due to the other. The density of electron generally, determines the thermo-dynamical equilibrium state of the plasma. Another test related to density of electron being high sufficient for collisions to dominate the levels population. This standard was primarily formulated and is now named the criterion of McWhirter. The critical density of electron necessary to achieve the local thermal equilibrium (LTE) condition is given by the McWhirter criterion [15,16].
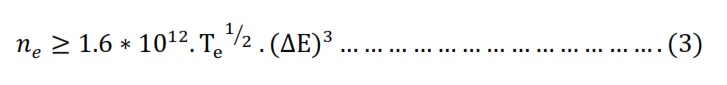
The fulfillment of this criterion is important for local thermodynamic equilibrium (LTE) to occur in a plasma.
However, it is only a necessary condition and is usually met during the early stages of the plasma’s existence [17]. The plasma temperature was determined by Equation (2), which is the Saha-Boltzmann (Te) equation and the electron density by fitting lines using McWhirter criteria which is Equation (4), as listed in Table 2.
![]()
Quantifying elemental composition
For a variety of applications in analytical chemistry, from environmental monitoring to biological research, knowing a sample’s elemental composition is crucial. In this paper, we propose a thorough method for calculating and examining sample elemental composition. We want to reveal the complex elemental composition of the tested samples using cutting-edge spectroscopic methods and mathematical models.
After determining the electron temperature (T), Equation (4) can be used to calculate the number density of all the elements detected in the spectrum through their spectral lines. This study focuses specifically on neutral atomic species and single ionized species since they are the ones observed within the analyzed spectral range. To determine the concentration of each species (Cs), their individual contributions are summed together as the equation (4).
Figures & Tables
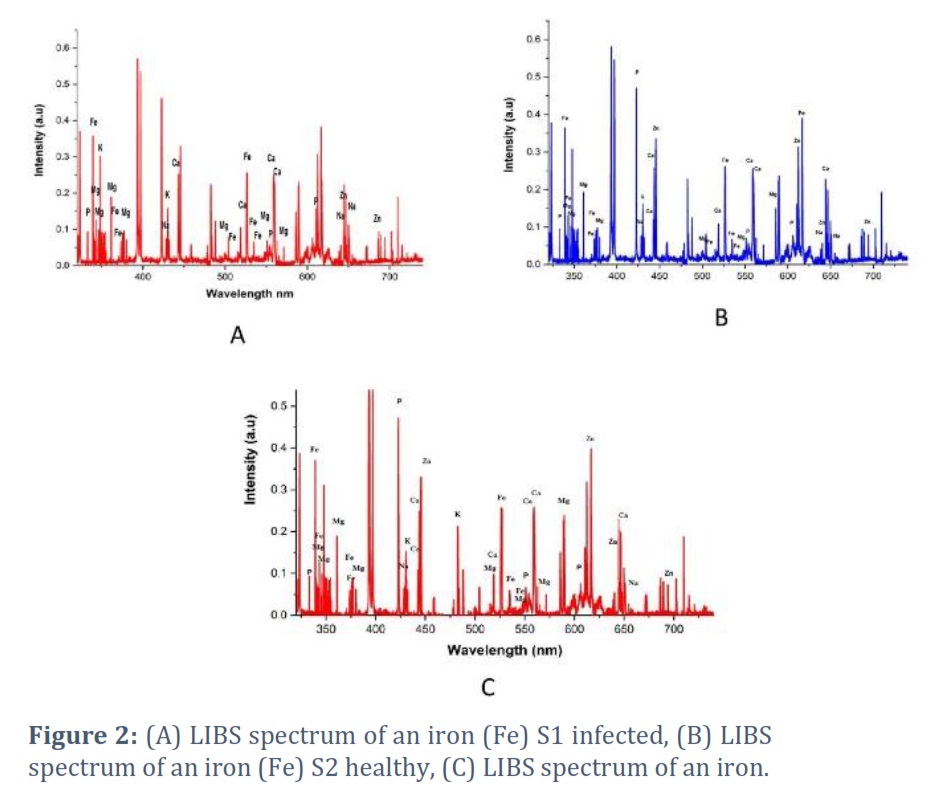
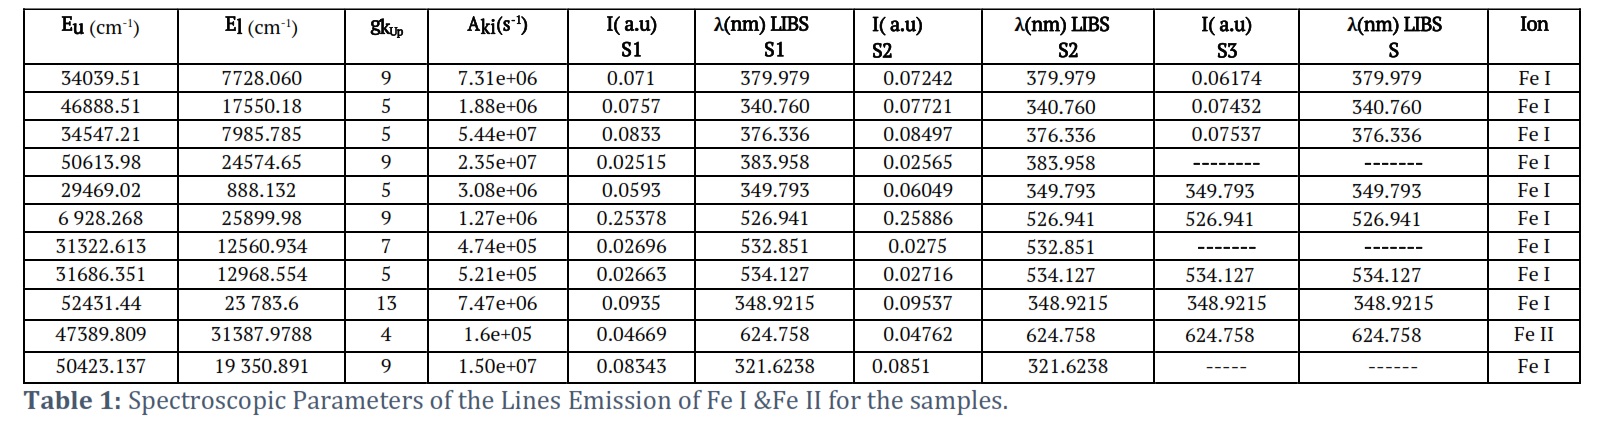
The spectral lines of samples are very important to obtain the important data required to determine atomic constants. The plasma temperature and electron density can then be calculated using these constants and the characteristic iron lines. Tables 1 provide a list of atomic spectroscopic parameters for neutral iron lines relevant to this study. Researchers can learn more about the atomic properties of the iron species present by analyzing the emitted spectra, which in turn can help them better understand underlying physiological or pathological processes. Traces of iron present in the serum of infected people appear as emission spectra in Figure 2 (A,C). These people likely have certain diseases or conditions that affect how their bodies use iron. The spectral lines emitted by iron species are indicated by the exact wavelengths shown in this figure, which enable the calculation of atomic constants. Figure (B)2 shows the emission spectra of iron traces in the serum of healthy people. The spectra shown in this figure provide a way to examine and understand how these factors affect the emission properties of iron species. The scientific framework for analyzing the spectra emitted from traces of iron in the serum of infected, healthy, and non-infected people is explained in the attached figures and tables. These results support calculations of atomic constants, understanding the atomic properties of the iron species present, and determining plasma temperature and electron density. Through these Table 1, researchers can detect changes in energy levels, transition probabilities, line densities, and wavelengths of spectral lines emitted by Fe I and Fe II in different samples. These differences could enhance our understanding of the underlying mechanisms in affected individuals by shedding light on how infections or other conditions modify the atomic properties of iron species.
The percentages representing the concentrations of various elements or compounds within each sample show their relative abundance. The relative abundance of the particular element or compound of interest in Sample 1 is estimated to base on the concentration percentage of 28.6% [18].
Sample 2 had a marginally higher concentration percentage of 29.4% than the healthy sample, indicating a marginally higher abundance of the element or compound. This can imply that the contaminated sample’s composition has changed, or that certain chemicals are present [2]. Sample3 concentration is 26.4%, which is marginally lower than Samples 1 and 2 concentration percentages. This suggests that the element or compound is substantially less abundant in the damaged sample as compared to the other two samples [1]. Understanding the relative distribution and changes in particular elements or compounds among the samples can be gained by analyzing the concentration percentages. These variances may reflect variations in the samples’ elemental composition, chemical processes, or environmental influences. It is crucial to remember that the interpretation of concentration percentages should take into account additional pertinent information and analysis, such as the plasma parameters covered in Table 2. Together, these tables help to provide a thorough overview of the features of the samples and any potential ramifications of the observed variances.
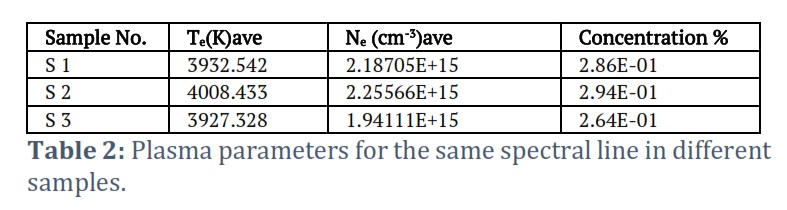
The plasma parameters for the same spectral line are shown in Table 2 for three separate samples, giving important details about the thermal and electrical characteristics of the plasma. With an average electron temperature (Te) of 3932.542 K and an average electron density (ne) of 2.18705E+15 cm-3, the healthy sample (Sample 1) displays the fundamental properties of a normal plasma.
The slightly rises to 4008.433 K in the infected sample (Sample 2), indicating a higher thermal energy than in the healthy sample. Additionally, the ne rises to 2.25566E+15 cm-3, indicating a larger concentration of free electrons, perhaps as a result of the addition of more charged particles to the plasma.
In contrast, Sample 3 (the damaged sample) exhibits a somewhat lower Te of 3927.328 K than the unaffected sample. Since the ne in this sample is 1.94111E+15 cm-3, there are probably less free electrons present. These changes in Te and ne can be a result of factors affecting the sample, such illness, or other environmental circumstances. Te is the average kinetic energy of the electrons in the plasma, and it gives information on the sample’s thermal state. ne, on the other hand, reflects the concentration or density of free electrons per unit volume and is essential for comprehending the electrical behavior of the plasma. Researchers can gauge changes in the plasma conditions by comparing the plasma parameters between the various samples and detecting differences in thermal energy and electron density. These discoveries are crucial for understanding plasma physics, diagnosing problems, and using plasma technology in a variety of disciplines like material science, astronomy, and fusion research. The comprehension of the physical and chemical processes taking place inside the samples is made easier by understanding the plasma properties. This knowledge can aid in the development of diagnostic methods and treatment plans for disorders affecting the impacted sample, as well as developments in plasma-based technology. Overall, the plasma parameters shown in Table 2 provides helpful information about the features and behavior of the plasma in various samples, opening up possibilities for more study and applications.
In conclusion, the use of laser-induced breakdown spectroscopy (LIBS) appears to be a promising technique for diagnosing renal failure in iron -deficient patients. The study showed that the level of iron concentration in blood samples of healthy individuals was more concentrated than that of infected individuals and those suffering from iron deficiency were significantly different. LIBS technology was able to accurately measure levels in blood samples, which can be used as a diagnostic tool for kidney failure. More studies are needed to confirm these findings and explore the potential of LIBS for the diagnosis and monitoring of other diseases.
Conflict of Interest
The authors declare that there is no conflict of interest.
The first author helped in developing and designing the research plan, in addition to playing a major role in collecting basic data. As for the second researcher, he had a significant contribution as he analyzed the data using appropriate statistical methods, which contributed significantly to highlighting the results and conclusions. While the third researcher took an active role in analyzing the results and formulating the basic aspects of the scientific paper. All authors participated in writing and formatting the text, as well as contributing to the literature review and editing of the paper, producing an integrated and diverse research effort.
![]() References
References
- Clark SF. Iron deficiency anemia. Nutrition in Clinical Practice: Official Publication of the Amerrican Society for parenteral and Enteral Nutrition, (2008); 23(2): 128-141.
- Pasricha SR, Tye-Din J, Muckenthaler MU, Swinkels DW. Iron deficiency. The Lancet, (2021); 397(10270): 233–248.
- Nwankwo CU, OBASI SC, Obasi SC. Renal Failure: Implication For Health Education. International Journal of Research, (2015); 9(1) ): 1-10.
- Schieppati A, Remuzzi G. Chronic renal diseases as a public health problem: epidemiology, social, and economic implications. Kidney International, (2005); 68: S7–S10.
- Luyckx VA, Tuttle KR, Garcia-Garcia G, Gharbi MB, Heerspink HJ, et al. Reducing major risk factors for chronic kidney disease. Kidney international supplements, (2017); 7(2): 71-87.
- Wilson K, Brownstein JSJC. Early detection of disease outbreaks using the Internet. Cmaj, (2009); 180(8): 829-831.
- Babushok V, DeLucia Jr F, Gottfried J, Munson C, Miziolek AJSAPBAS. Double pulse laser ablation and plasma: Laser induced breakdown spectroscopy signal enhancement. Spectrochimica Acta Part B: Atomic Spectroscopy, (2006); 61(9): 999-1014.
- Gaudiuso R, Melikechi N, Abdel-Salam ZA, Harith MA, Palleschi V, et al. Laser-induced breakdown spectroscopy for human and animal health: A review. Spectrochimica Acta Part B: Atomic Spectroscopy, (2019); 15(2): 123-148.
- Kelley SO, Mirkin CA, Walt DR, Ismagilov RF, Toner M, et al. Advancing the speed, sensitivity and accuracy of biomolecular detection using multi-length-scale engineering. Nature nanotechnology, (2014); 9(12): 969-980.
- Singh VK, Jaswal BS, Sharma J, Rai PK. Analysis of stones formed in the human gall bladder and kidney using advanced spectroscopic techniques. Biophysical reviews, (2020); (12) 647-668.
- Chasapis CT, Ntoupa PSA, Spiliopoulou CA, Stefanidou ME. Recent aspects of the effects of zinc on human health. Archives of toxicology, (2020); (94): 1443-1460.
- Mohamed WTY. Fast LIBS identification of aluminum alloys. Progress in Physics, (2007); 2: 287-92.
- Cremers, David A., and Leon J. Radziemski. Handbook of laser-induced breakdown spectroscopy. 2013; John Wiley & Sons.
- Gaudiuso R, Dell’Aglio M, De Pascale O, Senesi GS, De Giacomo AJS. Laser induced breakdown spectroscopy for elemental analysis in environmental, cultural heritage and space applications: a review of methods and results. Sensors, (2010); 10(8): 7434-7468.
- Xu H, Cheng Y, Xu Z, Chin SL. Characterization of Femtosecond Laser Filament-Induced Plasma and Its Application to Atmospheric Sensing. Progress in ultrafast intense laser science VIII, 145-160. 2012; Springer.
- Miziolek, Andrzej W., Vincenzo Palleschi, and Israel Schechter, eds.Laser induced breakdown spectroscopy. 2006 of publication; Cambridge university press.
- Faisal AQD, Jameel ZN, Moosa AAJE, Journal T. Preparation of Silver and Gold Nanoparticles By Using Nd-YAG Pulse Laser Ablation. Engineering and Technology Journal, (2014); 32(1): 138-144.
- Batchelor EK, Kapitsinou P, Pergola PE, Kovesdy CP, Jalal DIJJotASoNJ. Iron deficiency in chronic kidney disease: updates on pathophysiology, diagnosis, and treatment. Journal of the American Society of Nephrology: JASN, (2020); 31(3): 456.
This work is licensed under a Creative Commons Attribution-Non Commercial 4.0 International License. To read the copy of this license please visit: https://creativecommons.org/licenses/by-nc/4.0